¶ Viewing Current Status of Systems, Equipment, and Sensors
Current Status is a holistic and hierarchical overview of a plant showing the operational (running or tripped) status of each system within the plant. You can view the operational status of the equipment within the systems and the associated sensors too. The overview can be considered as the ‘Digital Representation’ of the entire plant.
If the systems (which include equipment, components, sub-components, and the associated tags) are in running condition, their digital representation appears in Green. On the contrary, if any of these have tripped, the relevant system is displayed in Red.
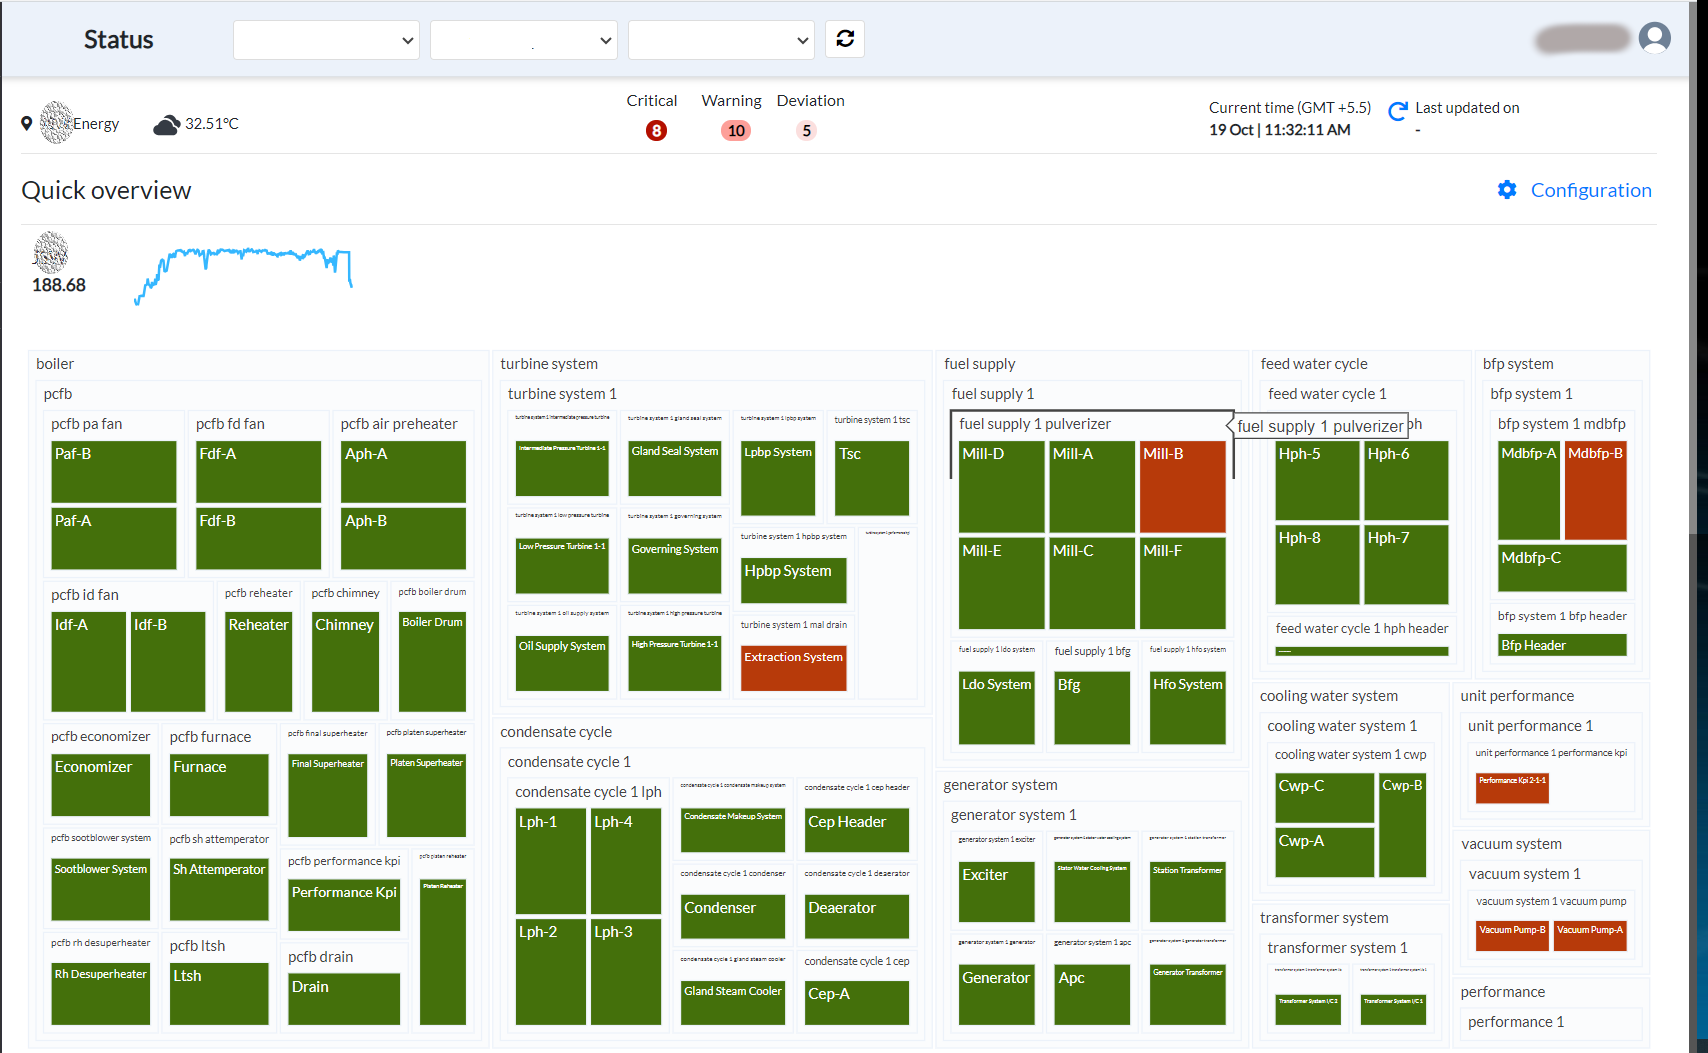
Figure 45. Status page
The load value and load tag display at the top left corner of the screen.
To drill further down from plant level and system level to the Equipment and associated tag level,
- Click the System and then click the relevant equipment within the System. The Quick overview screen now displays the health status of various tags associated with the assets.
The Status of the System and Equipment is also displayed.
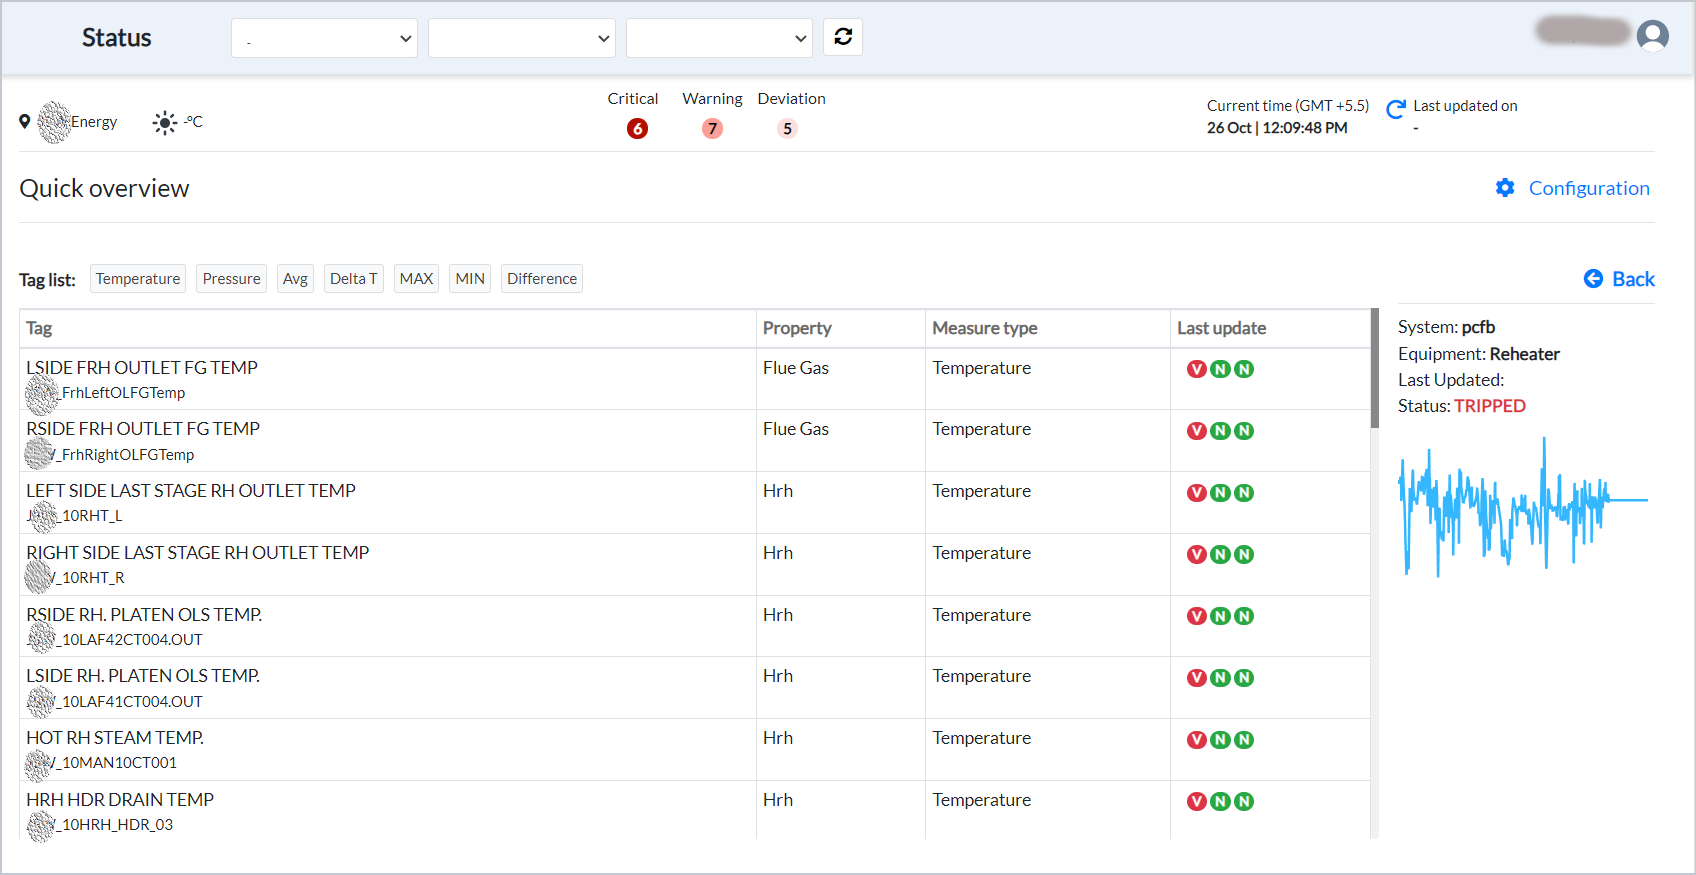
Figure 46. Tag list on status page
The graphical plot below Status is the plot of the conditional tag.
¶ Viewing Last Updated Details of Sensors
The Quick overview screen displays the health status of various tags associated with the assets, the Last update details of the Sensors, and also that of the System and Equipment.
The Last update column of the tags shows:
-
V - Data validity. It is either Green (valid) or Red (invalid). Valid data fluctuates within the threshold limits and is never constant even when the equipment is in running condition.
-
Alarm Load is displayed as follows:
-
H in Red color - High Alarm Load with high severity, with flag load being 3.
-
H in Orange color - High Alarm Load with medium severity, with flag load being 2.
-
H in Yellow color - High Alarm Load with low severity, with flag load being 1.
-
L in Red color - Low Alarm Load with high severity, with flag load being -3.
-
L in Orange color - Low Alarm Load with medium severity, with flag load being -2.
-
L in Yellow color - Low Alarm Load with low severity, with flag load being -1.
-
N in Green color - Normal.
-
-
Alarm Model - N in Green color - Normal.
-
Alarm Model - Red, Orange, and Yellow colors - High, Medium, and Low severity respectively.
NOTE:
Alarm Load: Every tag will be benchmarked based on historically available values and is checked against these values if it is above/below its "normal operational range". If the tag lies within this range, the Alarm Load is considered to be Normal and would be proportional to the flag load values.
Whereas the values for Alarm Model are based on predictions or models that are built. If the values of the tags which have models built are within the normal operational range, the Alarm Model is deemed to be Normal.
¶ Plotting graphic representation of Health of Sensor and Viewing Benchmark at Varying Load
To Plot the graph of a tag of an Equipment and view the Benchmark at varying load,
-
Click anywhere in the row of the tag.
-
Now select Quick Time Range or a Date Range, and then select Data Resolution.
-
Click Plot. A graphical representation, with Load tag in violet color and Data tag in blue color, displays at the bottom for the selected tag.
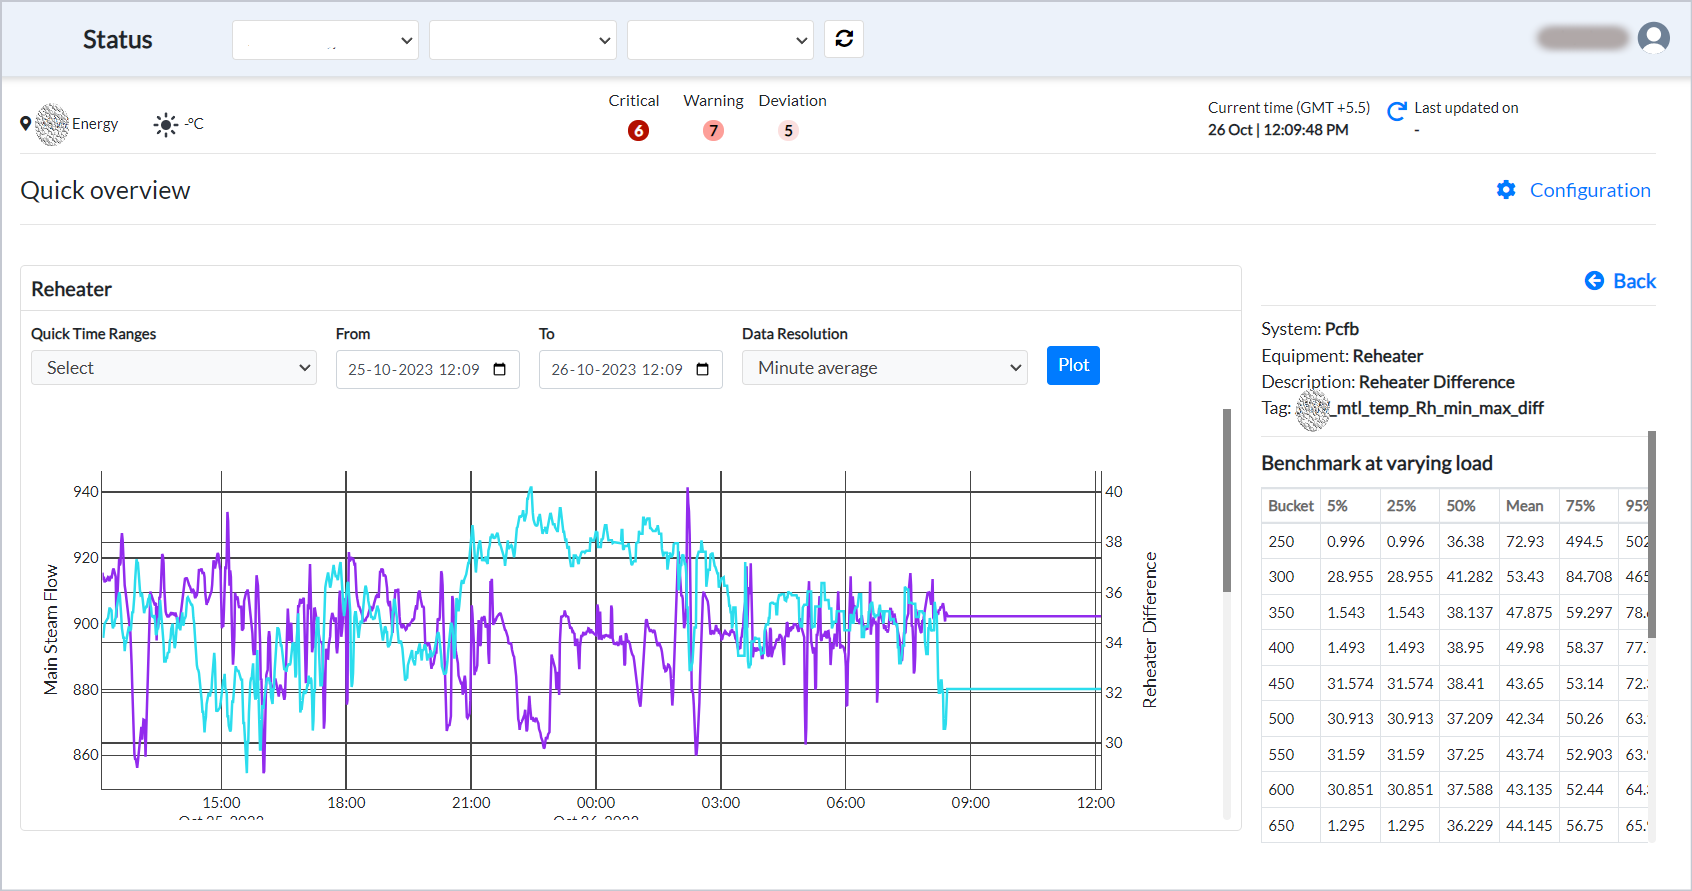
Figure 47. Quick overview
- Scroll further down to view the scattered plot and histogram. The scattered plot displays the relationship between load tag and the selected tag, while the histogram distributes data of selected tag on an interval scale.
¶ On the Fly Mapping Parameters to Sensors
The Current Status screen allows you to map on the fly the parameters to sensors. To do this,
- Click the Configuration link on the right side of the screen. The Admin Configuration popup displays. All the parameters display under the Parameters column.
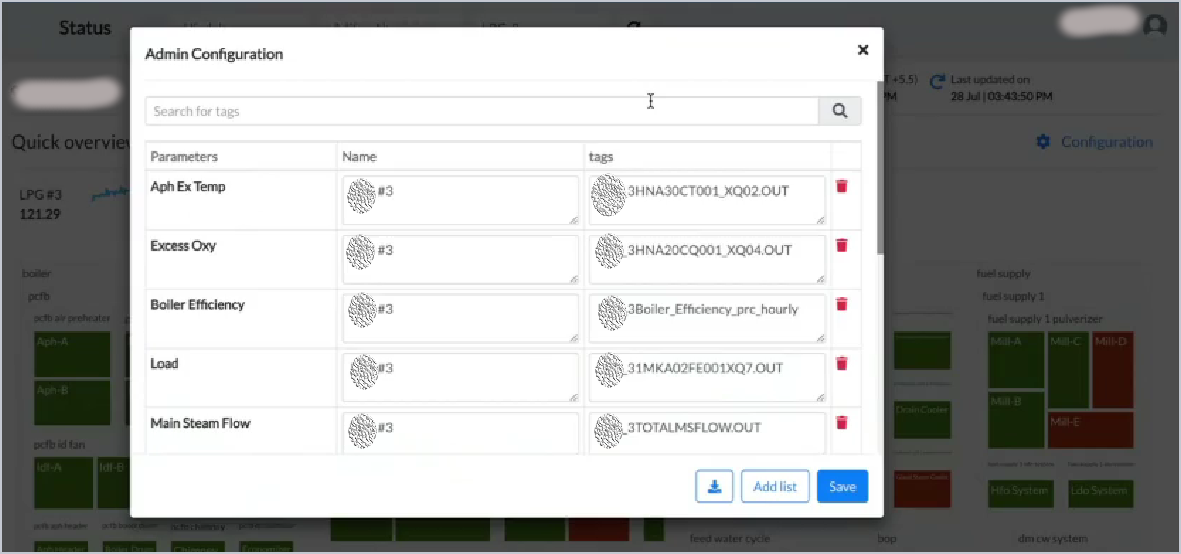
Figure 48. Admin configuration
-
To search for tags,
-
Enter the initial characters of the tag in the Search box.
-
To add additional parameters and then map relevant tags, click Add list. A blank row displays at the bottom.
-
Enter the parameter, name, and tag. (Please add Dict as a suffix to the parameter name, for example - loadDict) Separate the tags by a comma, if there are more than one tags to map.
-
Click Save. The tags are mapped to the relevant parameter.
-
To download the metadata of the tags, click the download button.