¶ Incident (Alarms) Engine
An Incident is an early warning or alarm triggered by a predictive model that identifies deterioration in an asset’s or process’s health parameters. The Incident management system acts as a crucial gateway for plant users, enabling them to identify abnormal operations, track insights, and take action to resolve issues effectively. It represents a collection of multiple related issues developing over time. When combined with all associated communications and data, it creates a single, comprehensive record for easy future reference. By delivering predictive insights, automating root cause identification, and enabling collaborative decision-making, the Incident (Alarms) Engine transforms the traditional approach to plant monitoring and enhances overall operational efficiency.
¶ Key Features of the Incident Management System:
1. Proactive Insights:
-
Delivers early or predictive warnings about potential issues.
-
Consolidates all relevant information, such as root cause analysis, historical data, trends, and associated insights, into a single interface for streamlined decision-making.
2. Simplified User Experience:
-
Eliminates the need for users to go through hundreds of alarms or dashboards to identify issues.
-
Reduces manual analysis efforts by presenting actionable insights in a comprehensive format.
3. Lifecycle Management:
-
Once an Incident is created, the system tracks the progress of the triggering event.
-
Monitors relevant parameters defined in the Asset Fault Signature database (Fault Trees).
-
Automatically identifies root causes and suggests corrective actions for the trigger condition.
-
Closes the Incident once the event is normalized.
4. Collaboration and Communication:
-
Enables users to collaborate and communicate effectively to troubleshoot issues.
-
Consolidates all plant communications related to an Incident into a single, comprehensive document for future reference.
¶ Benefits of the Incident (Alarms) Engine:
1. Enhanced Asset Reliability:
- Prevents forced outages and unplanned plant downtime by detecting issues before they escalate into critical problems.
2. Cost Efficiency:
- Reduces maintenance-related costs through early detection and resolution of issues across all plant assets.
3. Rapid Troubleshooting:
- Facilitates quicker resolution of issues using tools such as Root Cause Analysis (RCA) and Failure Mode and Effects Analysis (FMEA).
¶ Managing Incidents
The Incident Management module is a comprehensive data exploration, collaboration, and notification tool that empowers users to effectively address and resolve operational issues. This system allows users to escalate incidents into actionable "Tasks" and leverage the Tasks engine to manage follow-up activities until resolution and closure.
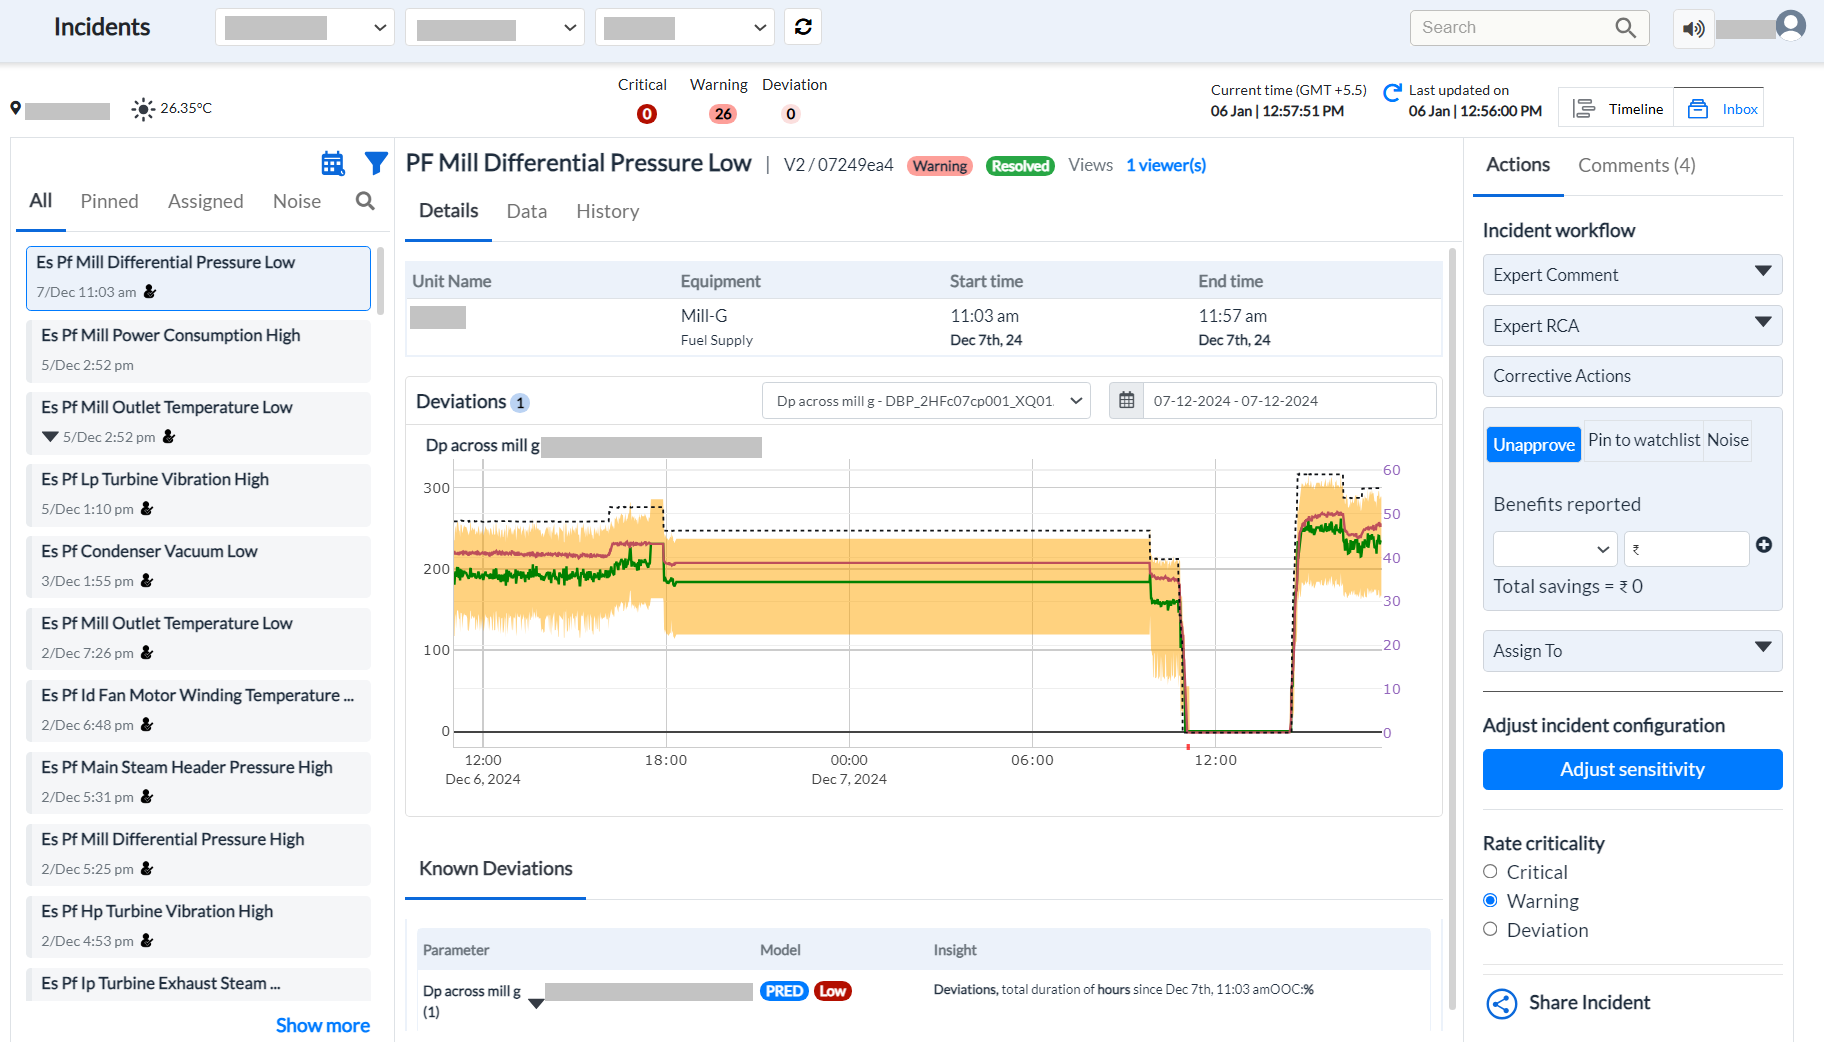
Figure 1 - Incident Page
¶ Key Features of the Incident Management System
1. Incident List
-
Overview: A mailbox-like functionality located in the left pane, displaying all developing issues and enabling users to bookmark, pin, or filter incidents for quick access.
-
Tabs for Organization:
-
All: Displays all incidents (Open and Closed) with Open ones listed at the top.
-
Pinned: Shows bookmarked incidents for priority tracking.
-
Assigned: Displays incidents assigned to specific users or teams.
-
Noise: Lists incidents marked as insignificant or low priority.
-
To view the Root Cause of an incident/deviation
- Click the down-arrow icon
 in the incident message. The row expands to display the Root Cause.
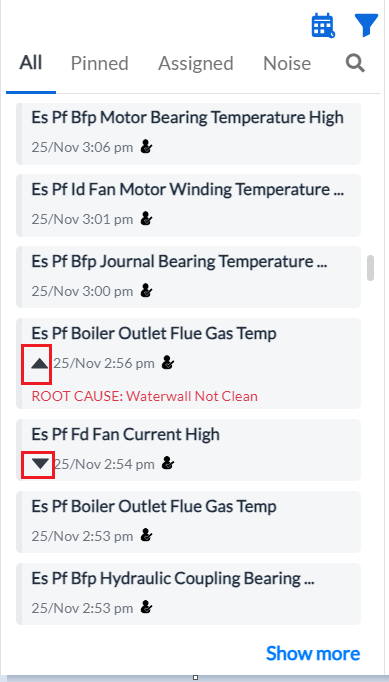
Figure 2 - Filter Incidents
To narrow down your search for incidents,
-
Click the filter icon at the top of the incidents list. The filtering criteria display.
-
Select the relevant option(s), or enter the equipment name in the Equipment field and click Apply.
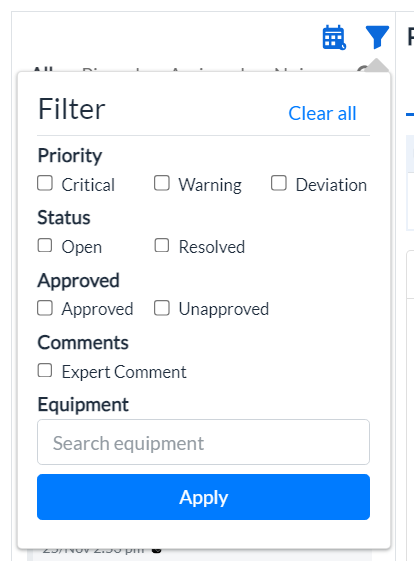
Figure 3 - Filter Option
The Incidents List displays the search result(s).
You can also search for an incident during a specific date range.
To do this,
-
Click the Date Picker icon
-
Select the date range. The Incidents List displays the search result(s).
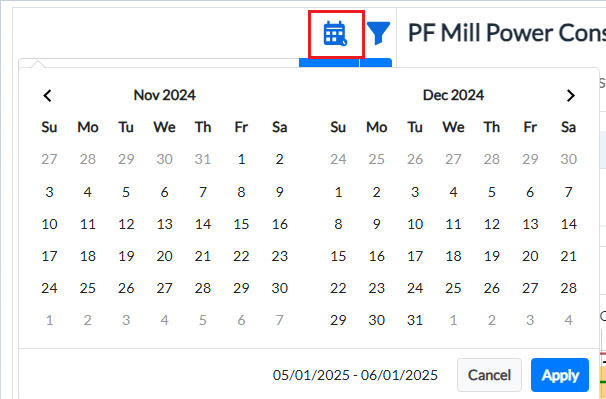
Figure 4 - Filter through Date
¶ Incident Details Page
-
Overview: Located in the middle pane, this section aggregates all relevant information required to diagnose the issue and take action.
-
Information Available:
-
List of signals triggering the incident.
-
Expected values or bands and deviations of individual signals based on predictive models.
-
Contributors to model deviations.
-
Root causes identified via the Asset Fault Signature database.
-
Trends of relevant signals (with expected bands).
-
Historical data of similar issues.
-
-
Actions:
-
Review unit name, equipment affected, start time, and deviations.
-
Analyze root causes, recommended actions, operator feedback, and past diagnostics.
-
¶ Viewing Incident Details
To view the details of an incident:
-
Select the incident from the list in the left pane. The details will appear in the middle pane under the default "Details" tab.
-
The section displays:
-
Unit Name and Equipment where the incident occurred.
-
Start time and number of deviations.
-
Known deviations, probable root causes, recommended actions, and operator feedback.
-
Indicators for root causes, including deviating parameters, alarm statuses, observed and expected values, and start/end times.
-
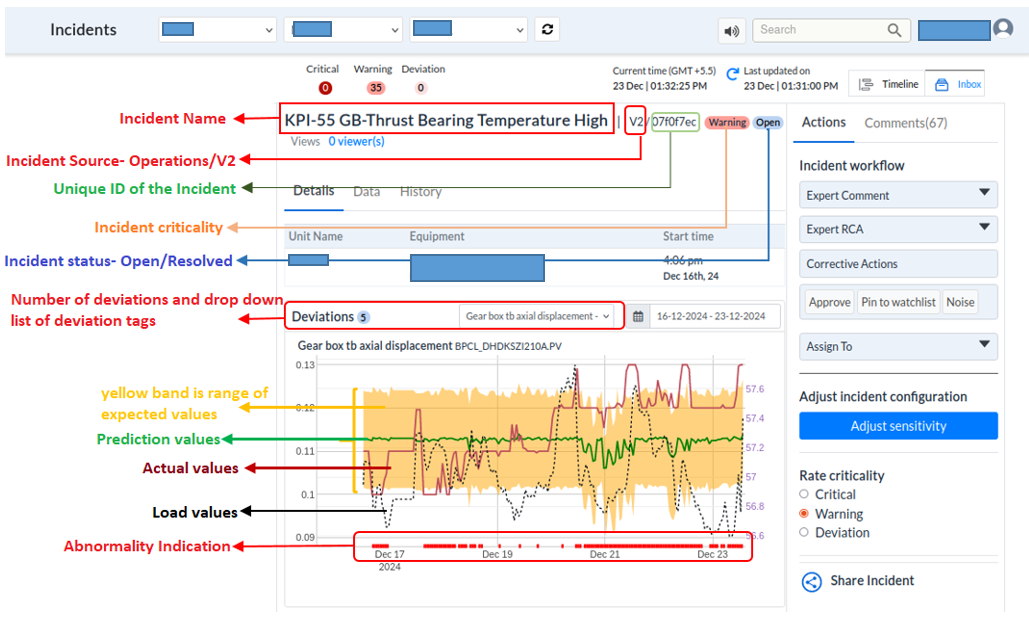
Figure 5 - Diagram to show various elements of the incidents page
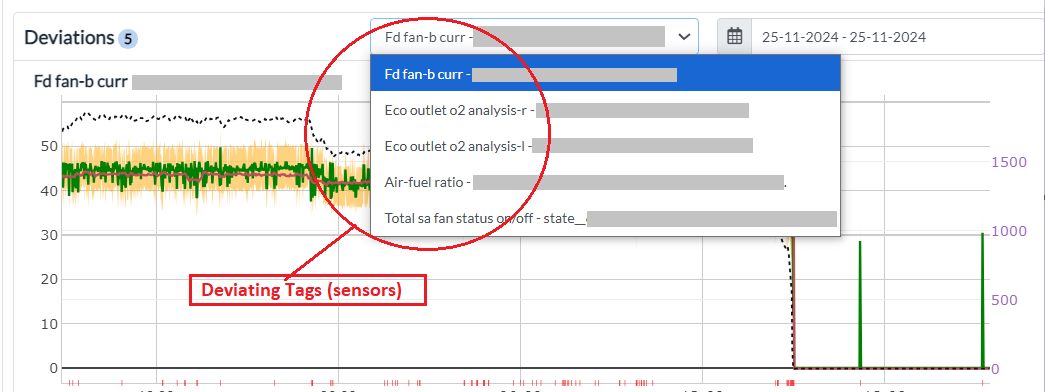
Figure 6 - Deviating Tags
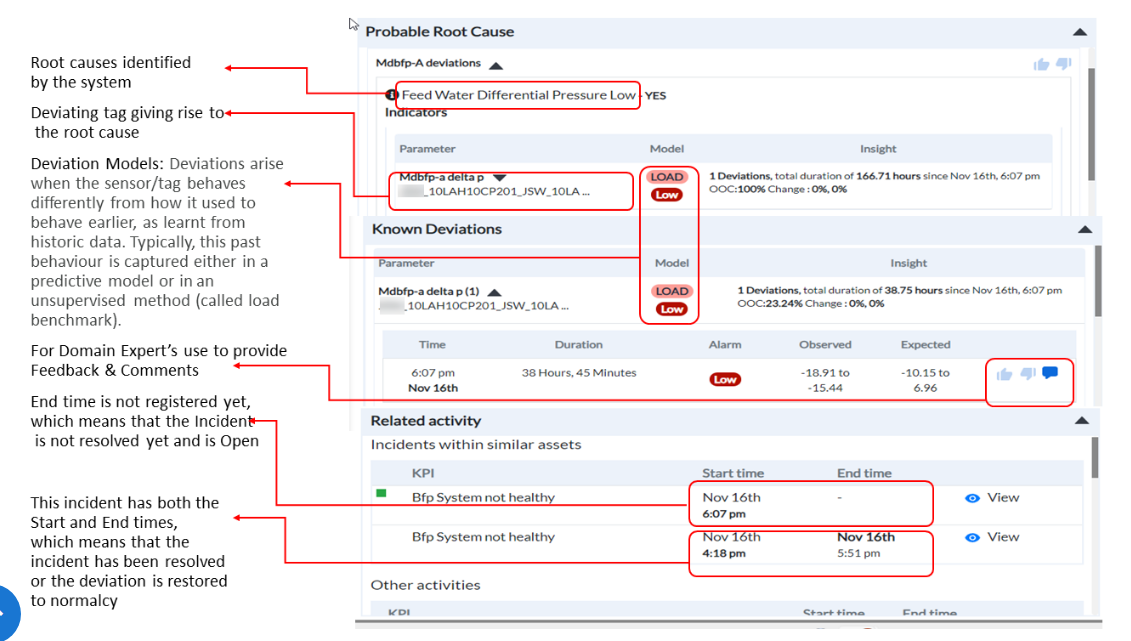
Figure 7 - The diagram to show various elements of the incidents page
¶ Probable Root Cause Analysis
-
Accessing the Root Cause Section:
-
Navigate to the incident message on the left side of the interface.
-
Click the down arrow to expand the Probable Root Cause section.
-
-
Exploring Additional Root Cause Details:
- After expanding the section, click on the Root Cause itself to view further details about the issue.
-
Information Available in the Expanded Root Cause Section:
-
The expanded section provides details such as:
1.-> Indicators identifying the issue (e.g., FD Fan Current High).
2.-> Specific parameters associated with the problem (e.g., FD Fan-b Curr).
3.-> The model type, such as Load, Prediction, or Threshold used to detect the issue (e.g., PRED, High).
4.-> Alarm Status showing whether thresholds are marked as Low or High.
5.-> Insights related to the deviations, including their duration and severity.
-
-
Providing Feedback:
-
After reviewing the probable root cause, you can either accept or reject it.
-
Add comments to share observations or suggestions for further analysis.
-
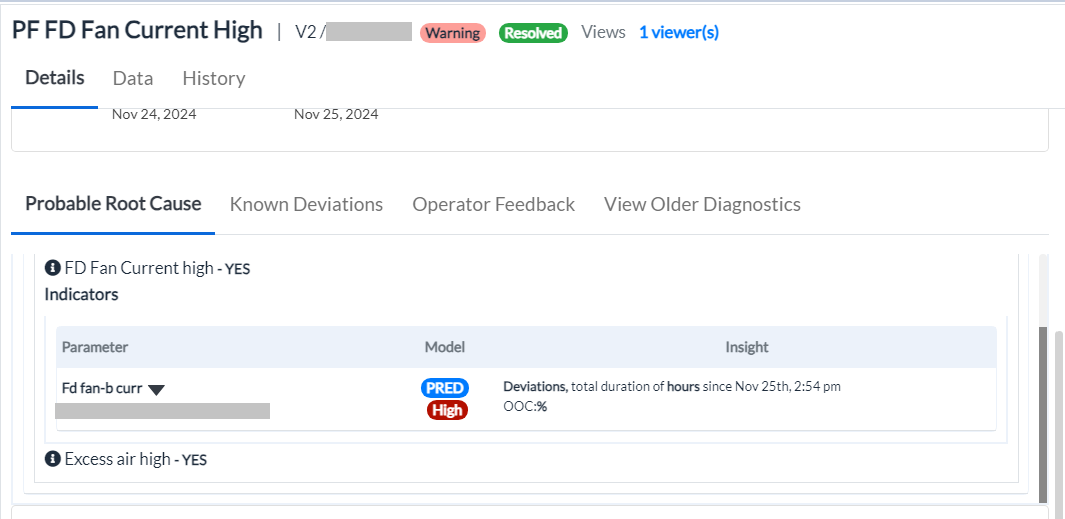
Figure 8 - Probable root cause expansion
¶ Known Deviations -
The known deviations grid displays
-
the deviating parameters (tags)
-
the status of Alarm (Low or High)
-
the Model (Load, Prediction, or Threshold based)
-
the Observed and Expected values, and
-
the Start time of the incident. If the incident has both Start and End times, it indicates that the incident has been resolved and the affected unit is restored to normalcy.
There are 3 types of Models in Pulse-
- Load Model (Load)- When the user selects “Load,” an option to “Confirm Re-Benchmark” is displayed. By clicking this option, the benchmarking process is reinitiated.
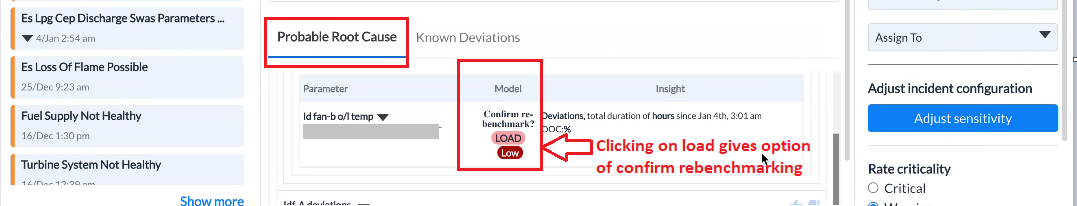
Figure 9 - LOAD
- Prediction Model (PRED)- When the user clicks on "PRED" under "Probable Root Cause" or "Known Deviations," a new window opens displaying input-output graphs for the selected tag. These graphs can be viewed on various time scales, including hourly, daily, weekly, monthly, and yearly.
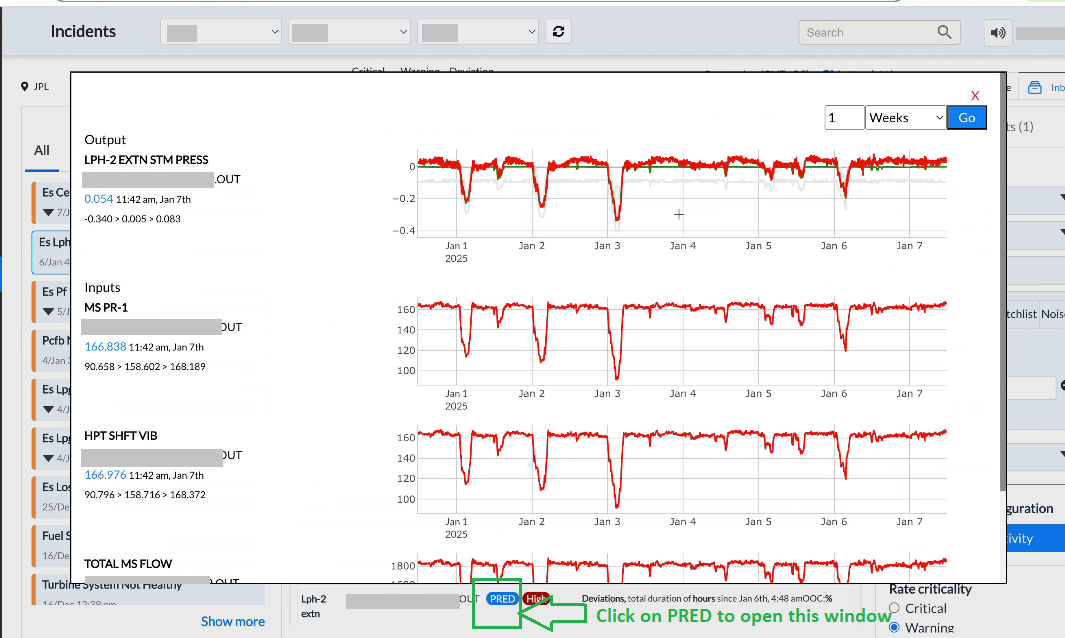
Figure 10 - PRED
- Threshold Model (THR)- Clicking the Threshold model does not display any specific feature
¶ Operator Feedback
-
Click the Operator Feedback tab to provide your feedback as an operator. The tab displays various probable root causes for the incident.
-
Select Yes or No for each one of them by way of your feedback.
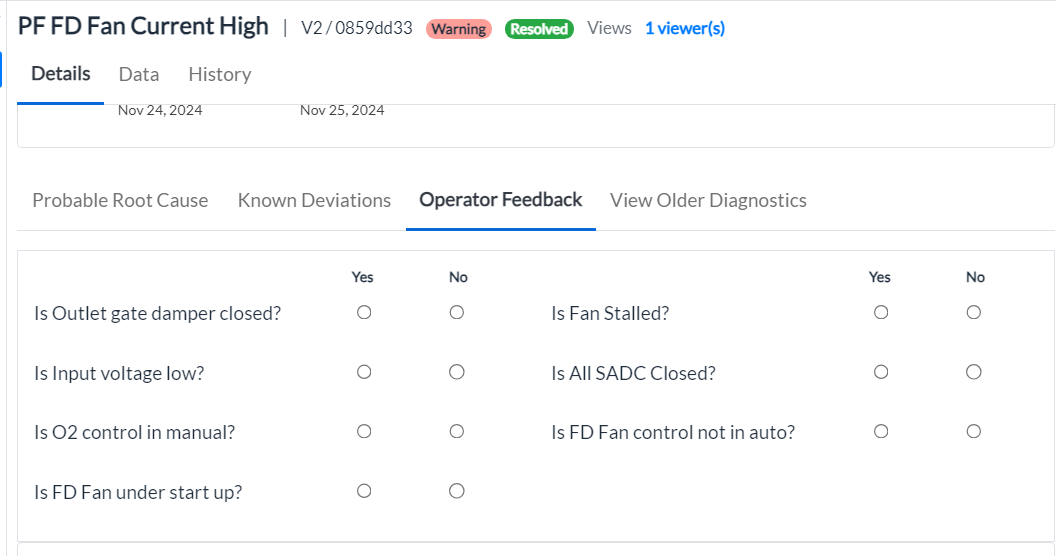
Figure 11 - Operator feedback
¶ Related Activity
The Related Activity section of the screen displays the mechanism through which the incident is generated. Other incidents in the same system (Open or Resolved) are also displayed.
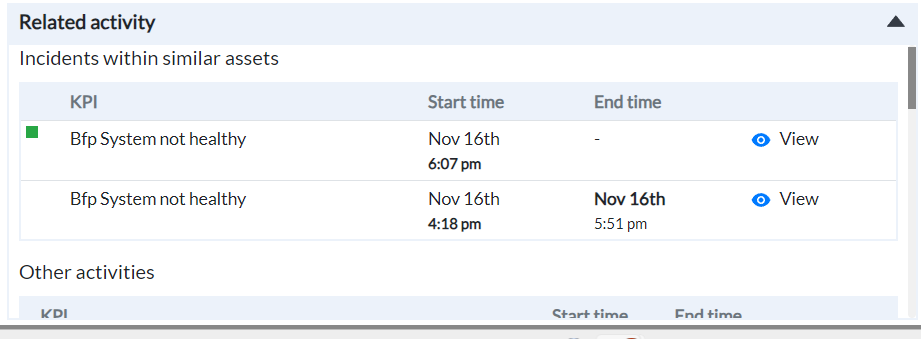
Figure 12 - Related activity
¶ Viewing Incident Data
The Data tab shows all the deviating tags that have contributed to the incident. The page displays the individual graphs of both "Expected Value" and "Observed Value" for each of the deviating tags.
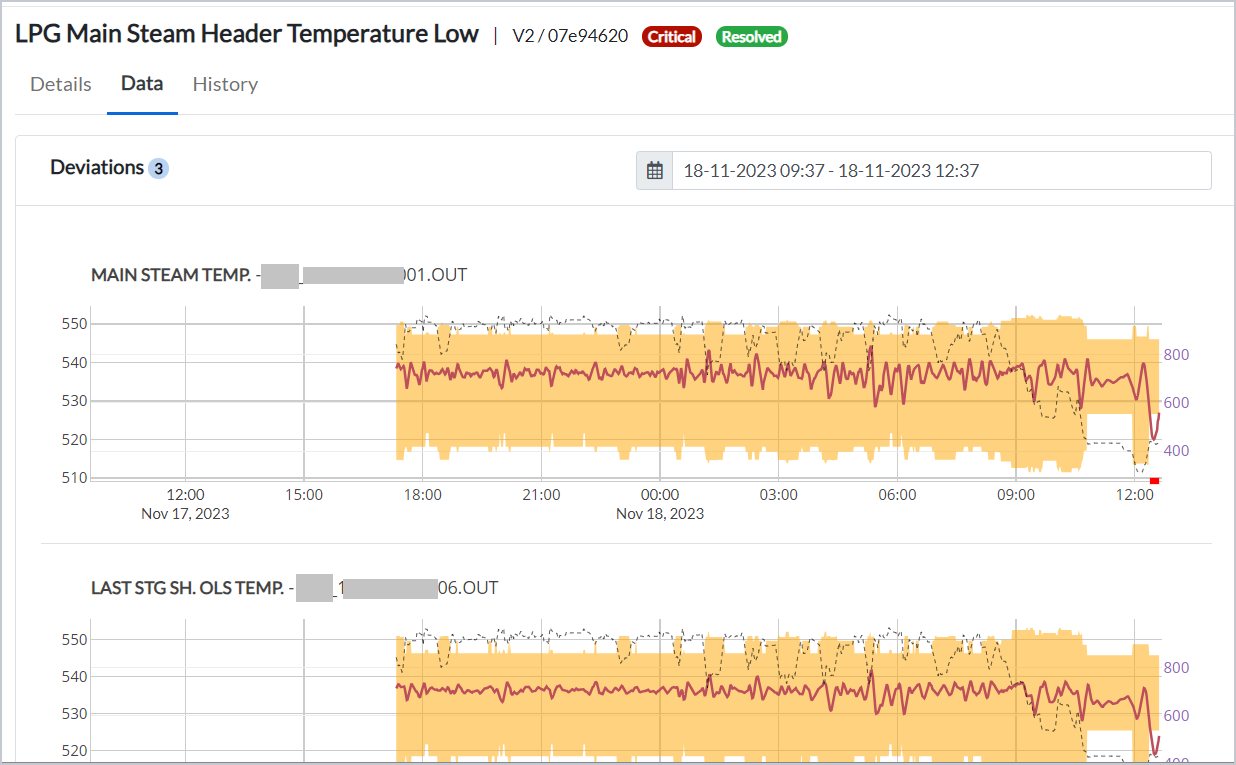
Figure 13 - Expected value and observed value
¶ Viewing Incident History
The History tab displays the record of previous occurrences of the same incident along with their respective time frames.
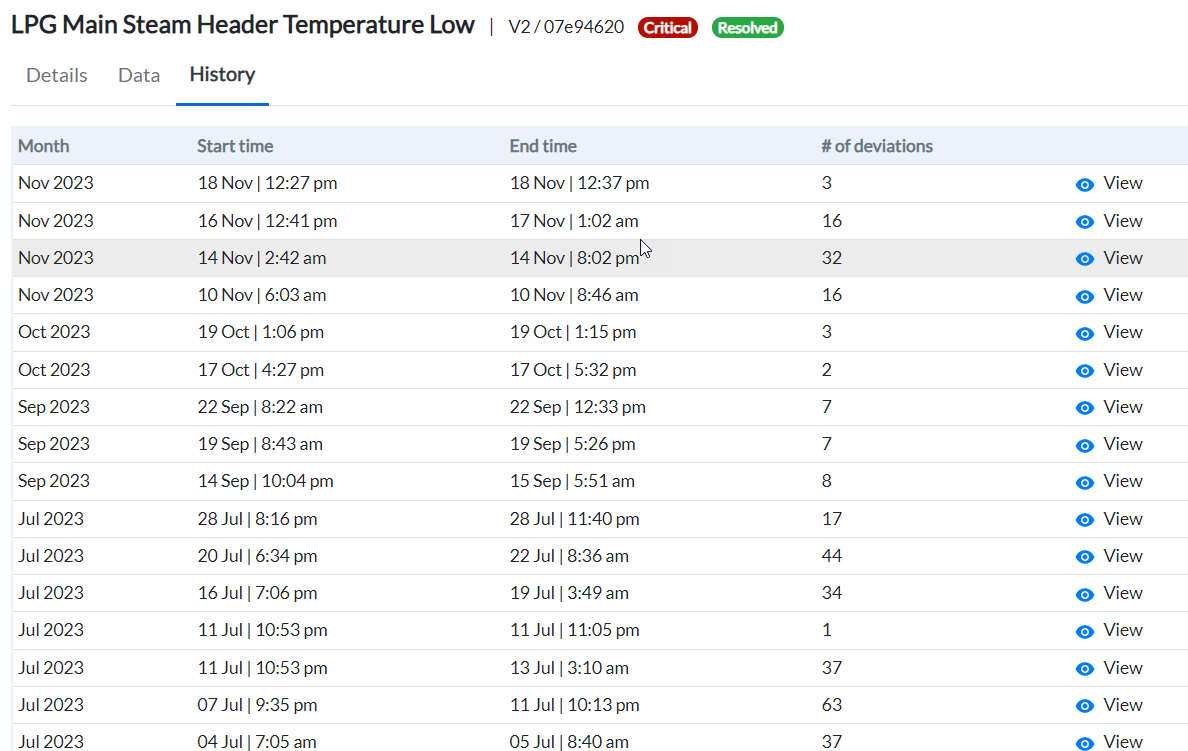
Figure 14 - Incident History
- To view any of the past incidents, click the view icon of the respective incident.
¶ User Actions and Comments
The right panel of the Incidents page consists of two tabs - Actions and Comments.
The Actions tab allows the users to provide feedback pertaining to an incident, which may be of help to further improve system accuracy.
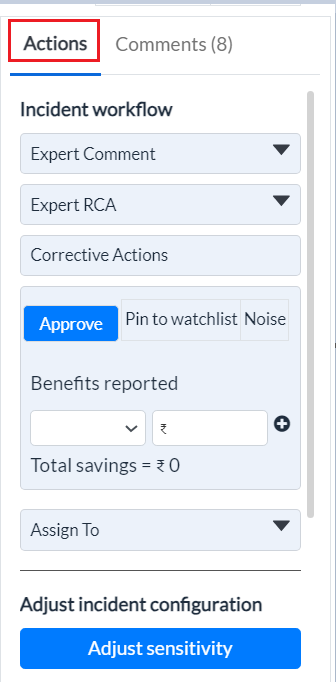
Figure 15 - Actions tab
The Incident Workflow section of the Actions tab allows:
-
Domain experts to submit their comments related to the selected incident
-
Domain experts to submit Root Cause Analysis related to the selected incident
-
Domain experts to add Corrective Actions carried out
-
Operator to approve the incident
-
Operator to Pin to watchlist, select incident to Noise or Aprrove incident
-
Operator to assign the selected incident to a user.
The detailed explanation is given below-
¶ Incident Workflow
¶ - Adding Expert Comments
-
Click the down arrow beside Expert Comments. The section expands to display a text box.
-
Enter your comments in the text box for this incident. These comments will be sent to the customer.
-
Click Submit.
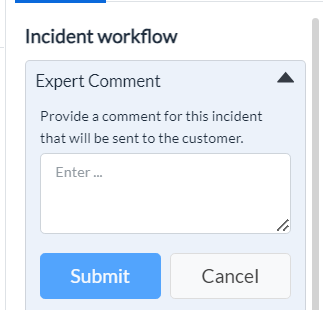
Figure 16 - Expert Comment
¶ - Adding Expert RCA
-
Click the down arrow beside Expert RCA. The section expands to display a text-box.
-
If the system has not identified any root cause, enter your detailed feedback of the actual fault identified at the site.
-
Click Submit.
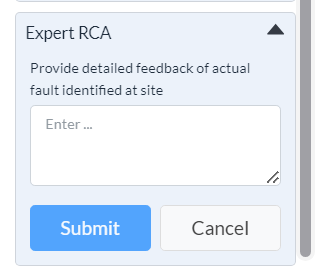
Figure 17 - Expert RCA
¶ - Suggesting Corrective Action
- Click Corrective Actions, the Correction Actions pop-up displays.
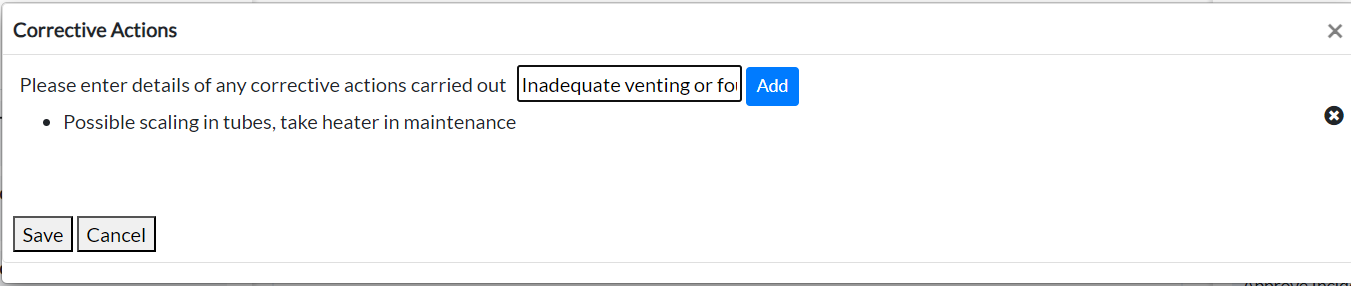
Figure 18 - Corrective Actions
-
Enter the details of the corrective actions you have carried out.
-
Click Add.
-
Click Save. The application seeks confirmation to save the corrective actions for the incident.
-
Click Confirm.
¶ - Managing Task Benefits and Savings
- Track Realized Benefits:
- When a task is created and subsequently resolved, users can record the realized costs or benefits incurred from that incident.
- Adding Benefits:
-
Use the drop-down menu under Benefits Reported to select the relevant benefit category.
-
Click the "+" button to add the benefit value associated with the resolved task or incident.
The drop-down contains a list of sectors where benefits can be recorded, such as
-
Avoided equipment failure (e.g., cost savings from preventing a breakdown)
-
Avoid shutdowns
-
Reduced maintenance costs
-
better maintenance
-
Performance improvement
- Calculate Total Savings:
-
The system automatically updates the Total Savings field based on the values entered.
-
Multiple tasks or incidents can be recorded, and their benefits aggregated by clicking the "+" button for each additional task.
- Additional Actions:
-
Approve: Mark the incident as approved for further tracking or reporting.
-
Pin to Watchlist: Pin the incident to the watchlist for monitoring.
-
Noise: Mark the incident as noise if it is not significant or does not require action.
This workflow helps users efficiently monitor and calculate savings or benefits from incidents, providing a clear record of realized value.
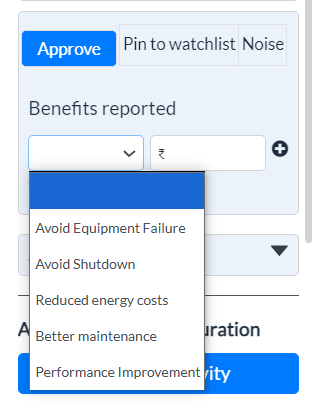
Figure 19 - Approve, Pin to watchlist, Noise
¶ - Assigning an Incident
-
Click the down arrow beside Assign To. The section expands to display the Search box.
-
Click in the box, the platform displays a list of users.
-
Select the user, and click Assign.
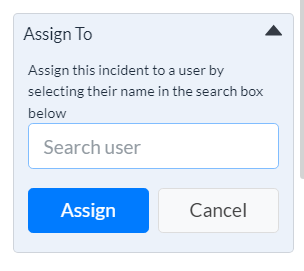
Figure 20 - Assign To
¶ - Adding Comments with or without Attachments
-
Click the Comments tab.
-
Enter your message.
-
Click the Add a File icon to attach a relevant file(s), if any.
-
Click the send arrow.
¶ - Adjusting Incident Sensitivity
In the Adjust Incident Configuration section under the Actions tab, you can modify the parameters that define deviations within an incident.
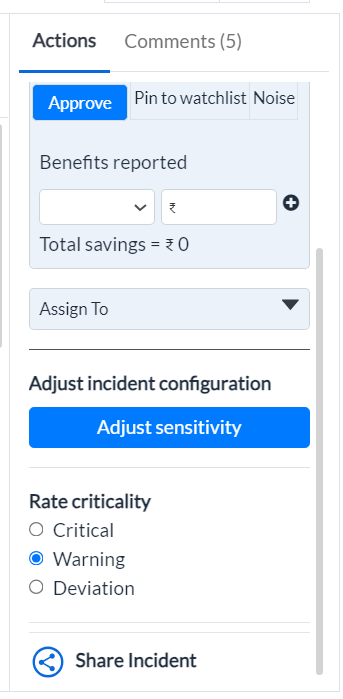
Figure 21 - Adjust Sensitivity and other options
Click on the Adjust Sensitivity button highlighted in blue color. A new window pops up showing adjust sensitivity and updates the user can do there.
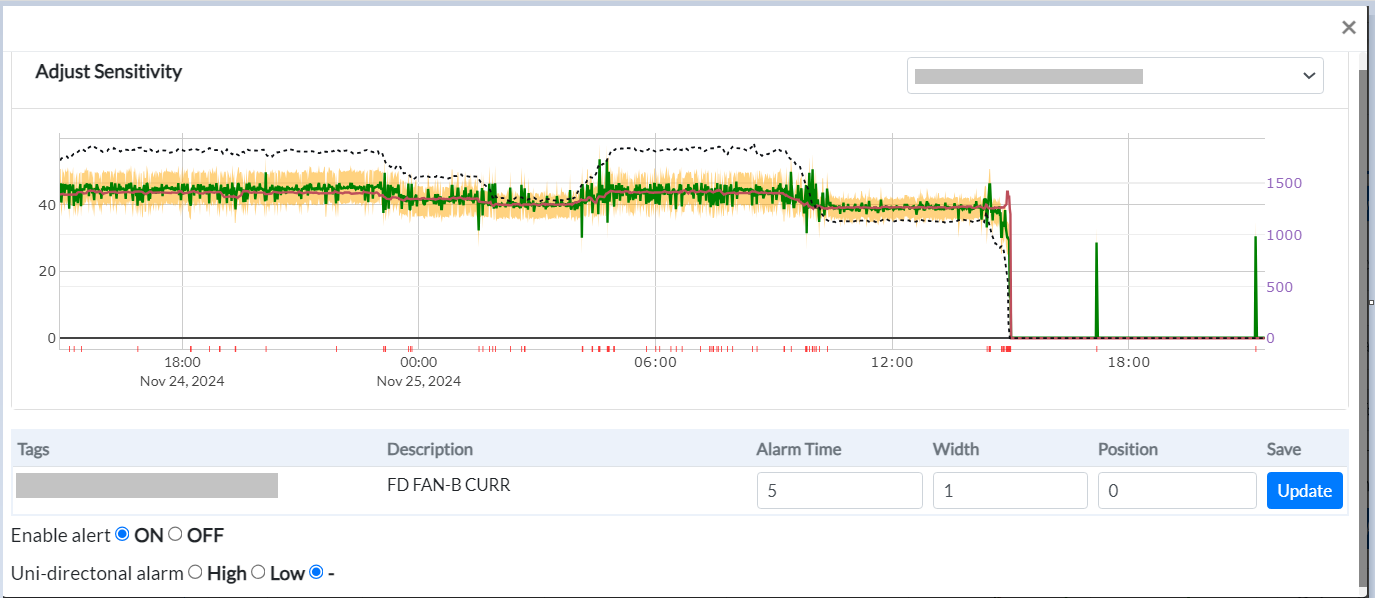
Figure 22 - Adjust sensitivity window
To adjust incident configuration:
- Select the Tag:
-
Choose the desired tag from the drop-down list.
-
The system will display the tag description, alarm time, width, and position details.
- Make the Necessary Adjustments:
-
Alarm Time: Specify the number of consecutive minutes the tag must remain outside the expected range before a deviation is triggered.
-
Width: Adjust the width of the yellow band, which represents the range of expected parameter values:
-
A default value of 1 is set.
-
Increasing the width (value > 1) expands the expected range.
-
Decreasing the width (value < 1 but > 0) narrows the expected range by that factor.
-
-
Position: Modify the offset to shift the entire expected range up or down. This is typically used to account for shifts in operating values following an overhaul or maintenance activity.
-
Save Changes:
- Click Update to apply the changes.
¶ Rate Criticality
-
Select Criticality:
- Choose the appropriate criticality level for the incident based on your assessment of its severity, relative to the system's default criticality rating.
-
Options:
-
Critical: Select this if the incident requires immediate attention without any delay.
-
Warning: Select this if the incident requires immediate attention but is not a top priority.
-
Deviation: Select this for incidents that deviate from expected values but do not require urgent attention.
-
¶ Sharing an Incident
To share the incident to other users of the platform,
-
Select the incident.
-
Click the Share Incident icon at the bottom right. The Share Incident popup displays.
-
Enter the email IDs separated by a comma (if you wish to share to more than one user).
-
Click Share.
-
To copy the link, click Copy Link.
The link is copied to your clipboard.