¶ Reports
The Reports feature within Pulse's reporting engine provides users with the ability to access Key Performance Indicator (KPI) reports, which offer insights into the performance of various KPIs. Users can use this feature to examine and analyze how well their key metrics are performing. Additionally, the tool offers convenient options for users to take action based on the information in the reports. Users have the flexibility to download the reports, allowing them to save or analyze the data offline. Moreover, the tool facilitates easy sharing of reports via email, enabling users to collaborate with team members or communicate important findings with stakeholders.
¶ Generating Reports
To generate Reports:
- Click the Reports tab in the Ops Center page.
The Reports page appears with these options:
-
Overall Summary
-
KPIs
-
Saved Reports
-
Equipment Exception Report
Note: By default the last opened report appears on the screen when you open the Reports page.
¶ Generating Overall Summary Report
To generate Overall Summary report:
- Click Overall Summary,
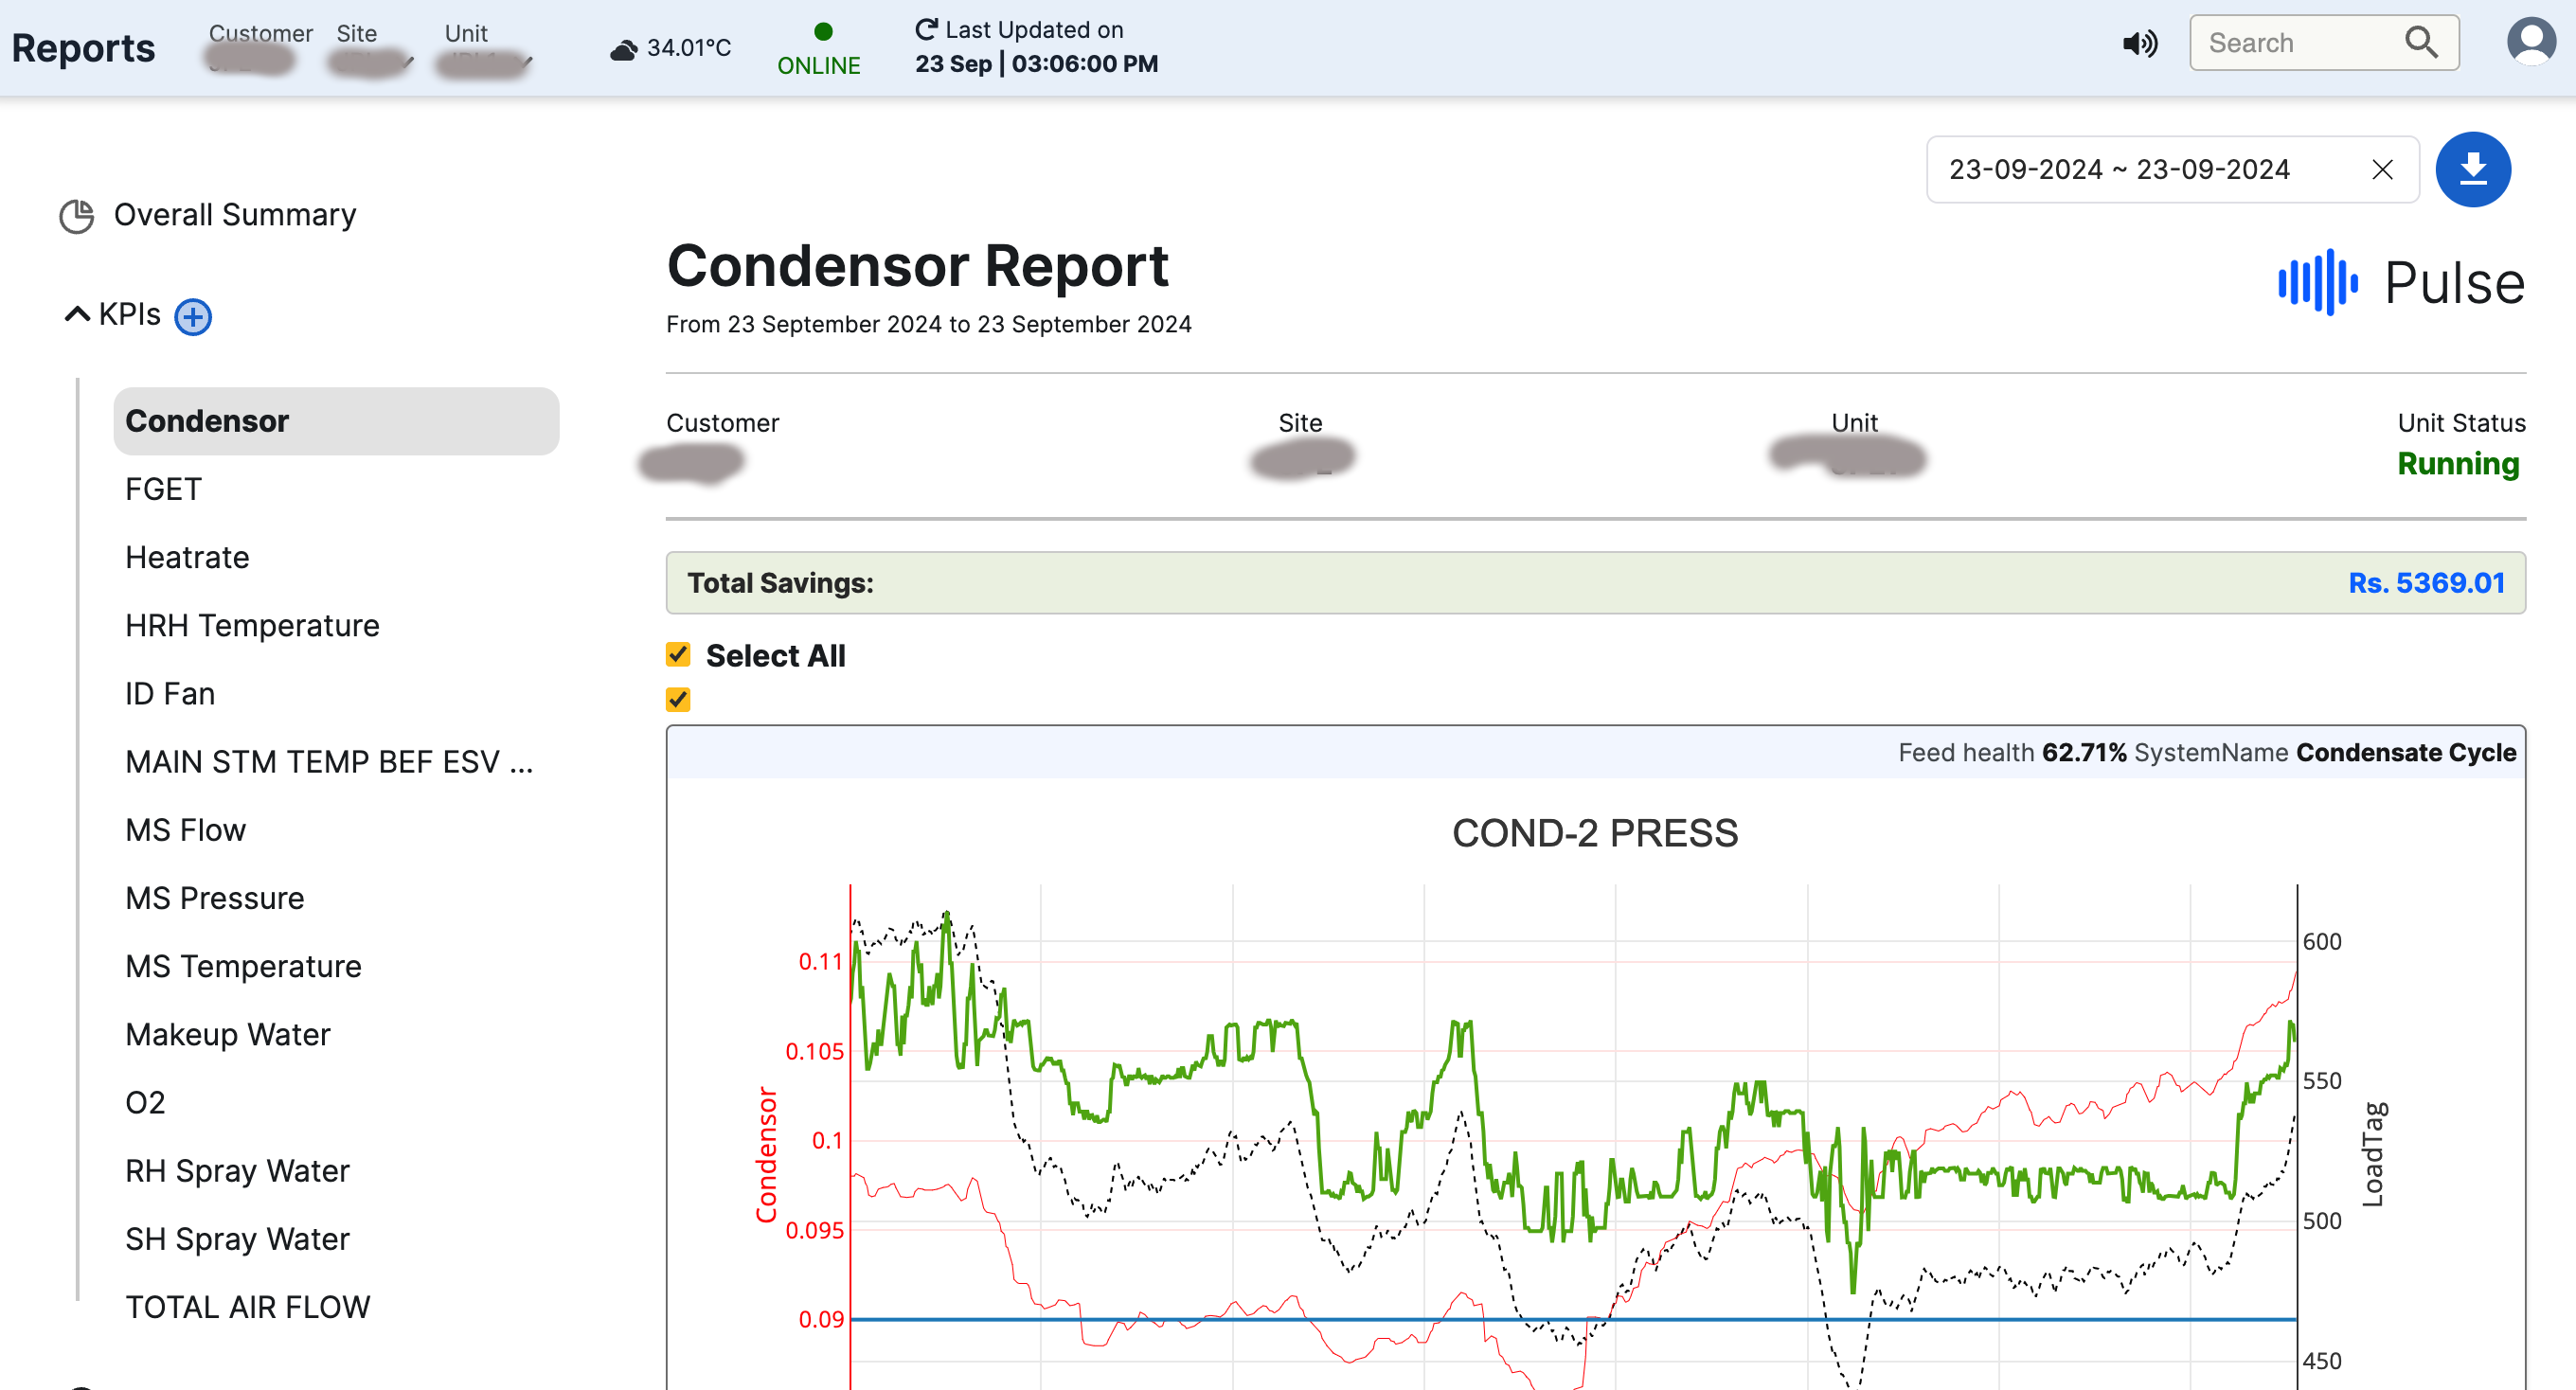
Figure 113. Reports page
Choose the graphs you want to incorporate into the PDF before dispatching the email.
Click Share,
A box to enter the email ID of the person to whom you want to send the report, appears.
-
Enter the required email ID(s) and click Send.
-
Click the download button beside the Share button, to download the reports.
¶ Generating KPI Related Reports
To generate KPI reports:
- Click KPIs,
A list of KPIs linked to the unit appear, such as:
-
O2
-
FGET
-
Heatrates
-
MS Pressure
-
Bed Temperature
-
MS Flow
-
MS Temperature
-
FW Flow
-
HRH Temperature
-
Condenser Vacuum
-
ID Fan
-
Makeup Water
-
SH Spray Water
-
RH Spray Water
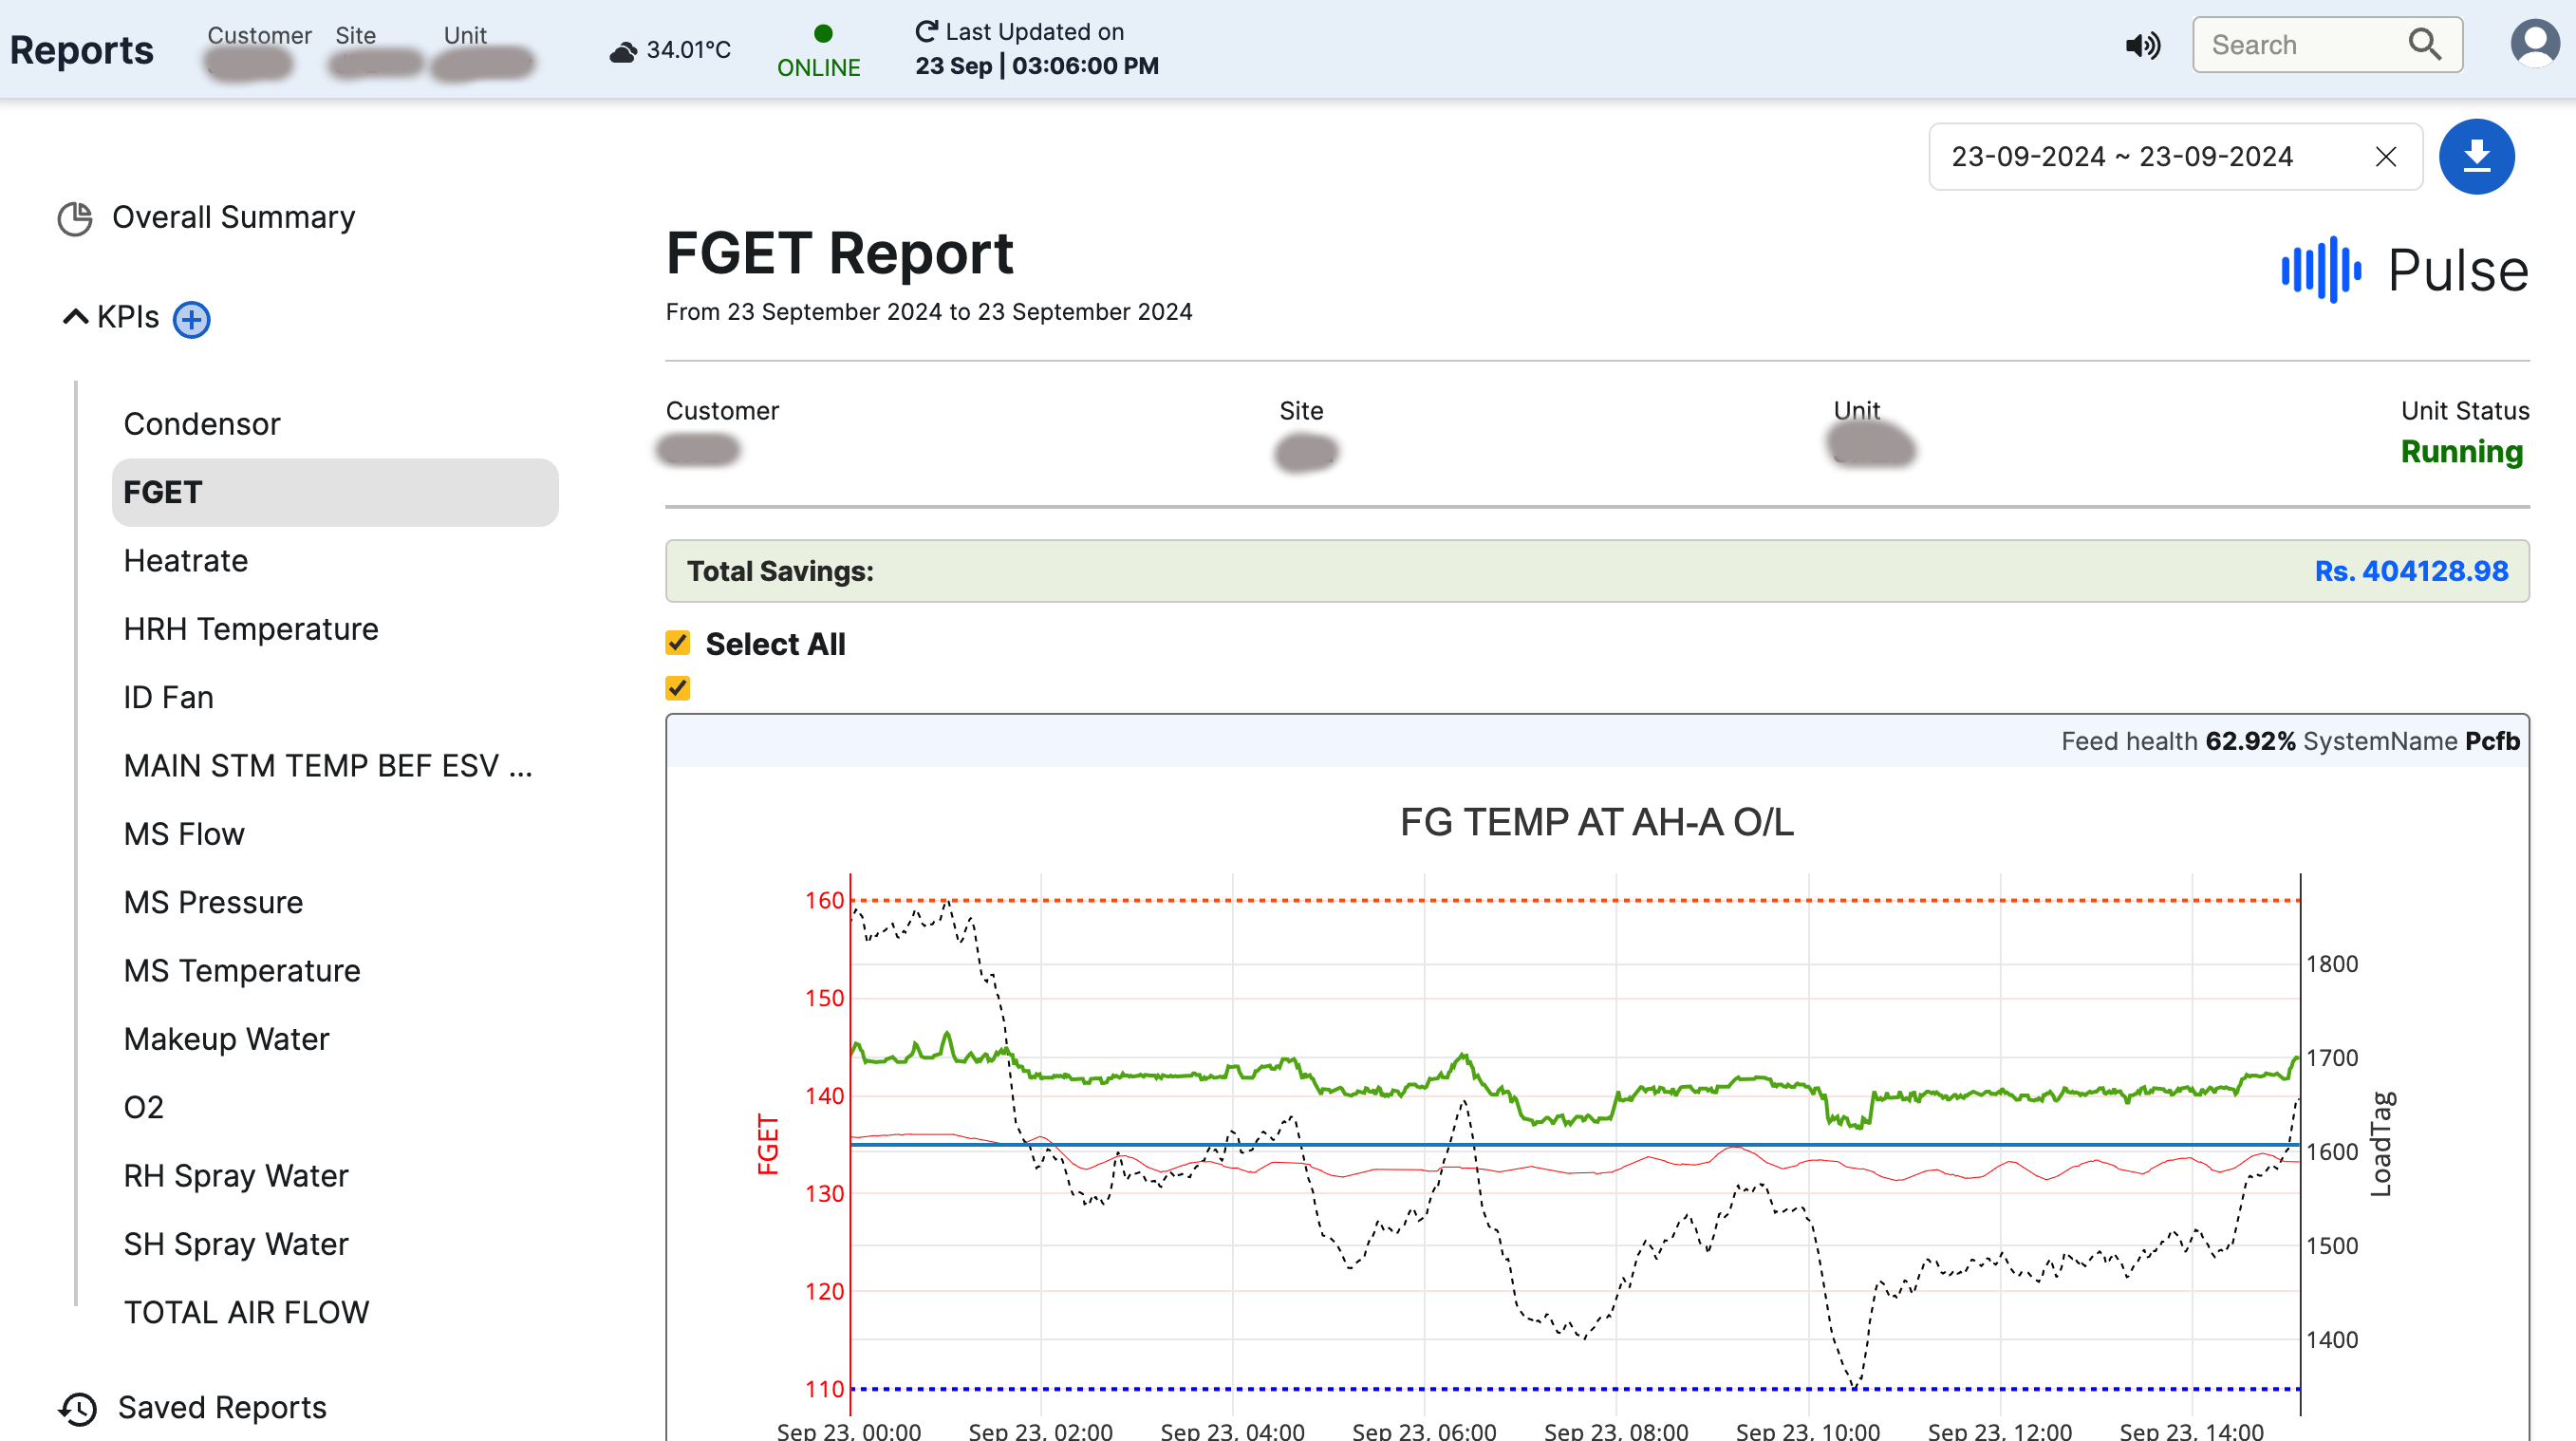
Figure 114. List of KPIs
Note: The KPIs are displayed based on the Unit and the related equipment.
-
Click each of the KPI to view the corresponding report that includes graphs and tables.
-
The graph illustrates the relationship between the KPI and the load, presenting best achieved values, predicted values, and the KPI's min-max band.
-
The tables indicate the load capacity at which the KPI is situated. Depending on the capacity, the table provides information on the minimum, maximum, and average values of the KPI for each specific category. Additionally, within the table, users can gain insights into potential savings by inputting expected savings values and cost per kilocalorie.
¶ Generating Equipment Exception Report
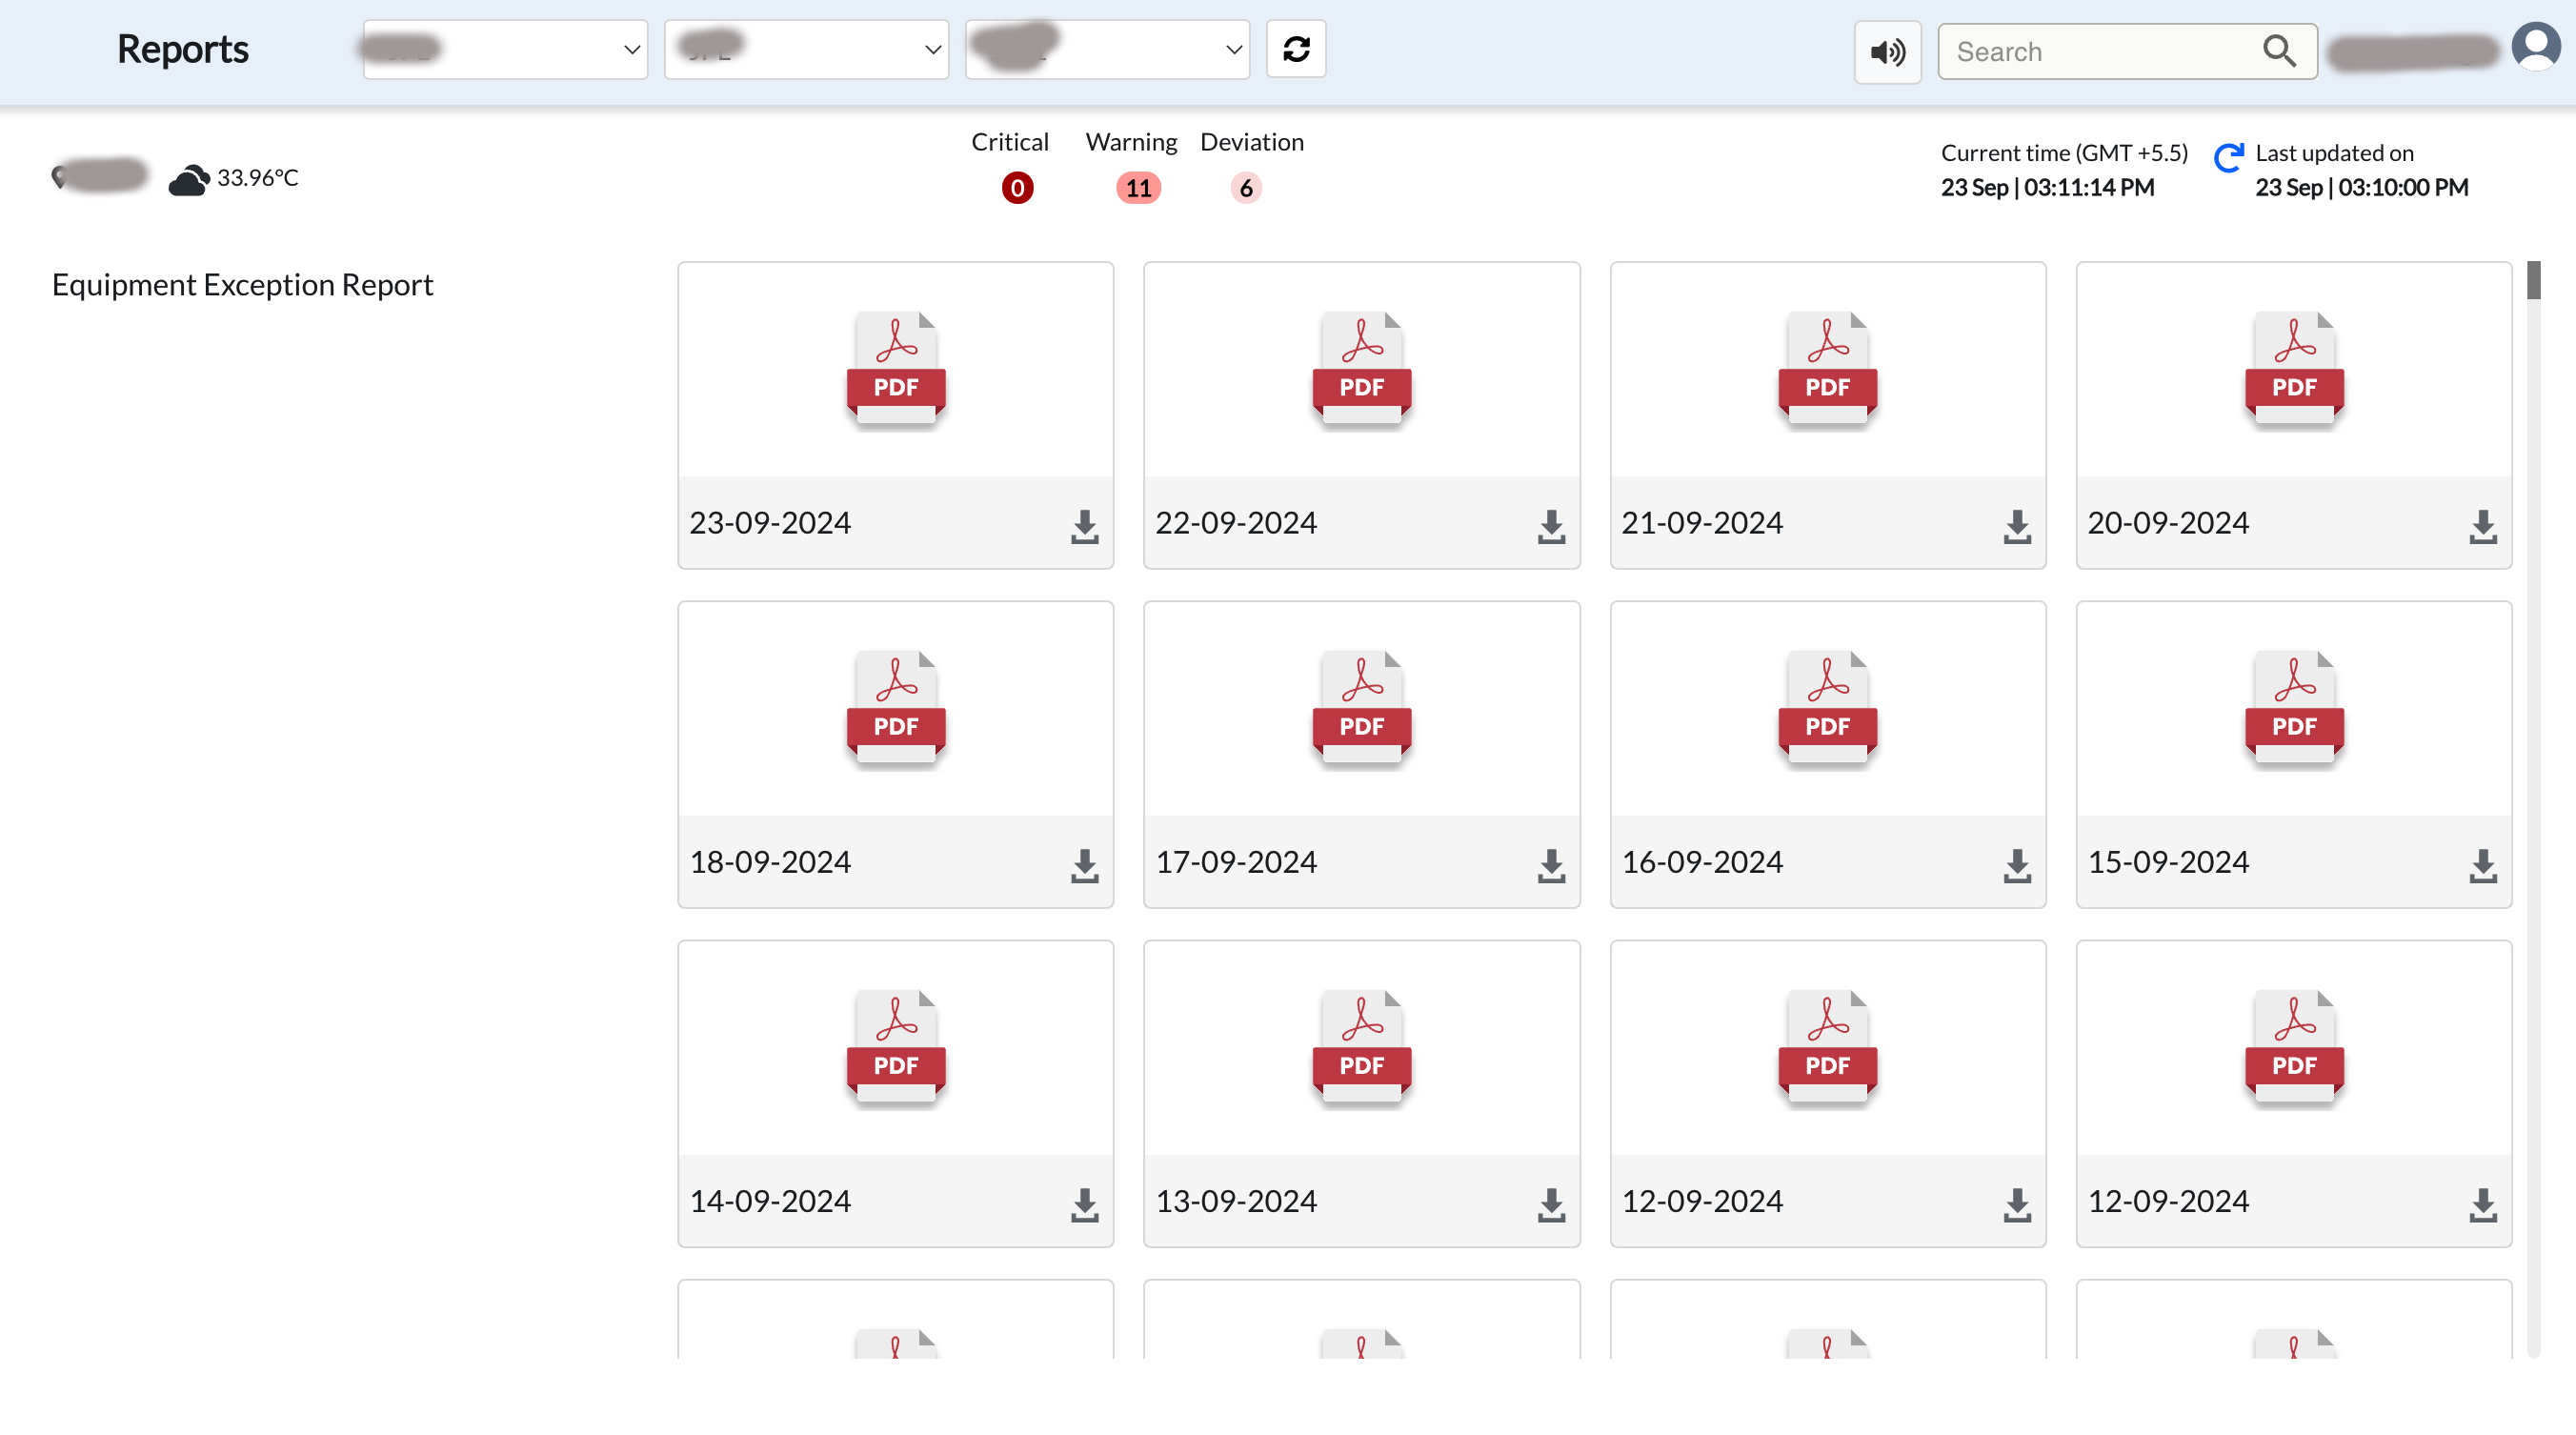
Figure 115. Equipment exception reports
To generate Equipment Exception Report:
- Click Equipment Exception Report,
Exception report pertaining to a piece of equipment appears.
-
Click the Calendar option on top to set the date range.
-
Click the download icon to download the file to your desktop.
Equipment Exception Report: This report extracts the most important events in the day, the longest running issues as well as an asset-wise summary of critical parameter deviations as generated by Incidents. It enhances the information for a user by also providing a 1-week trend, expected and actual range of values and a cumulative duration for which an issue persisted in a 1 week period.
¶ Viewing Saved Reports
To view and download the saved reports:
- Click Saved Reports,
The page shown here appears.
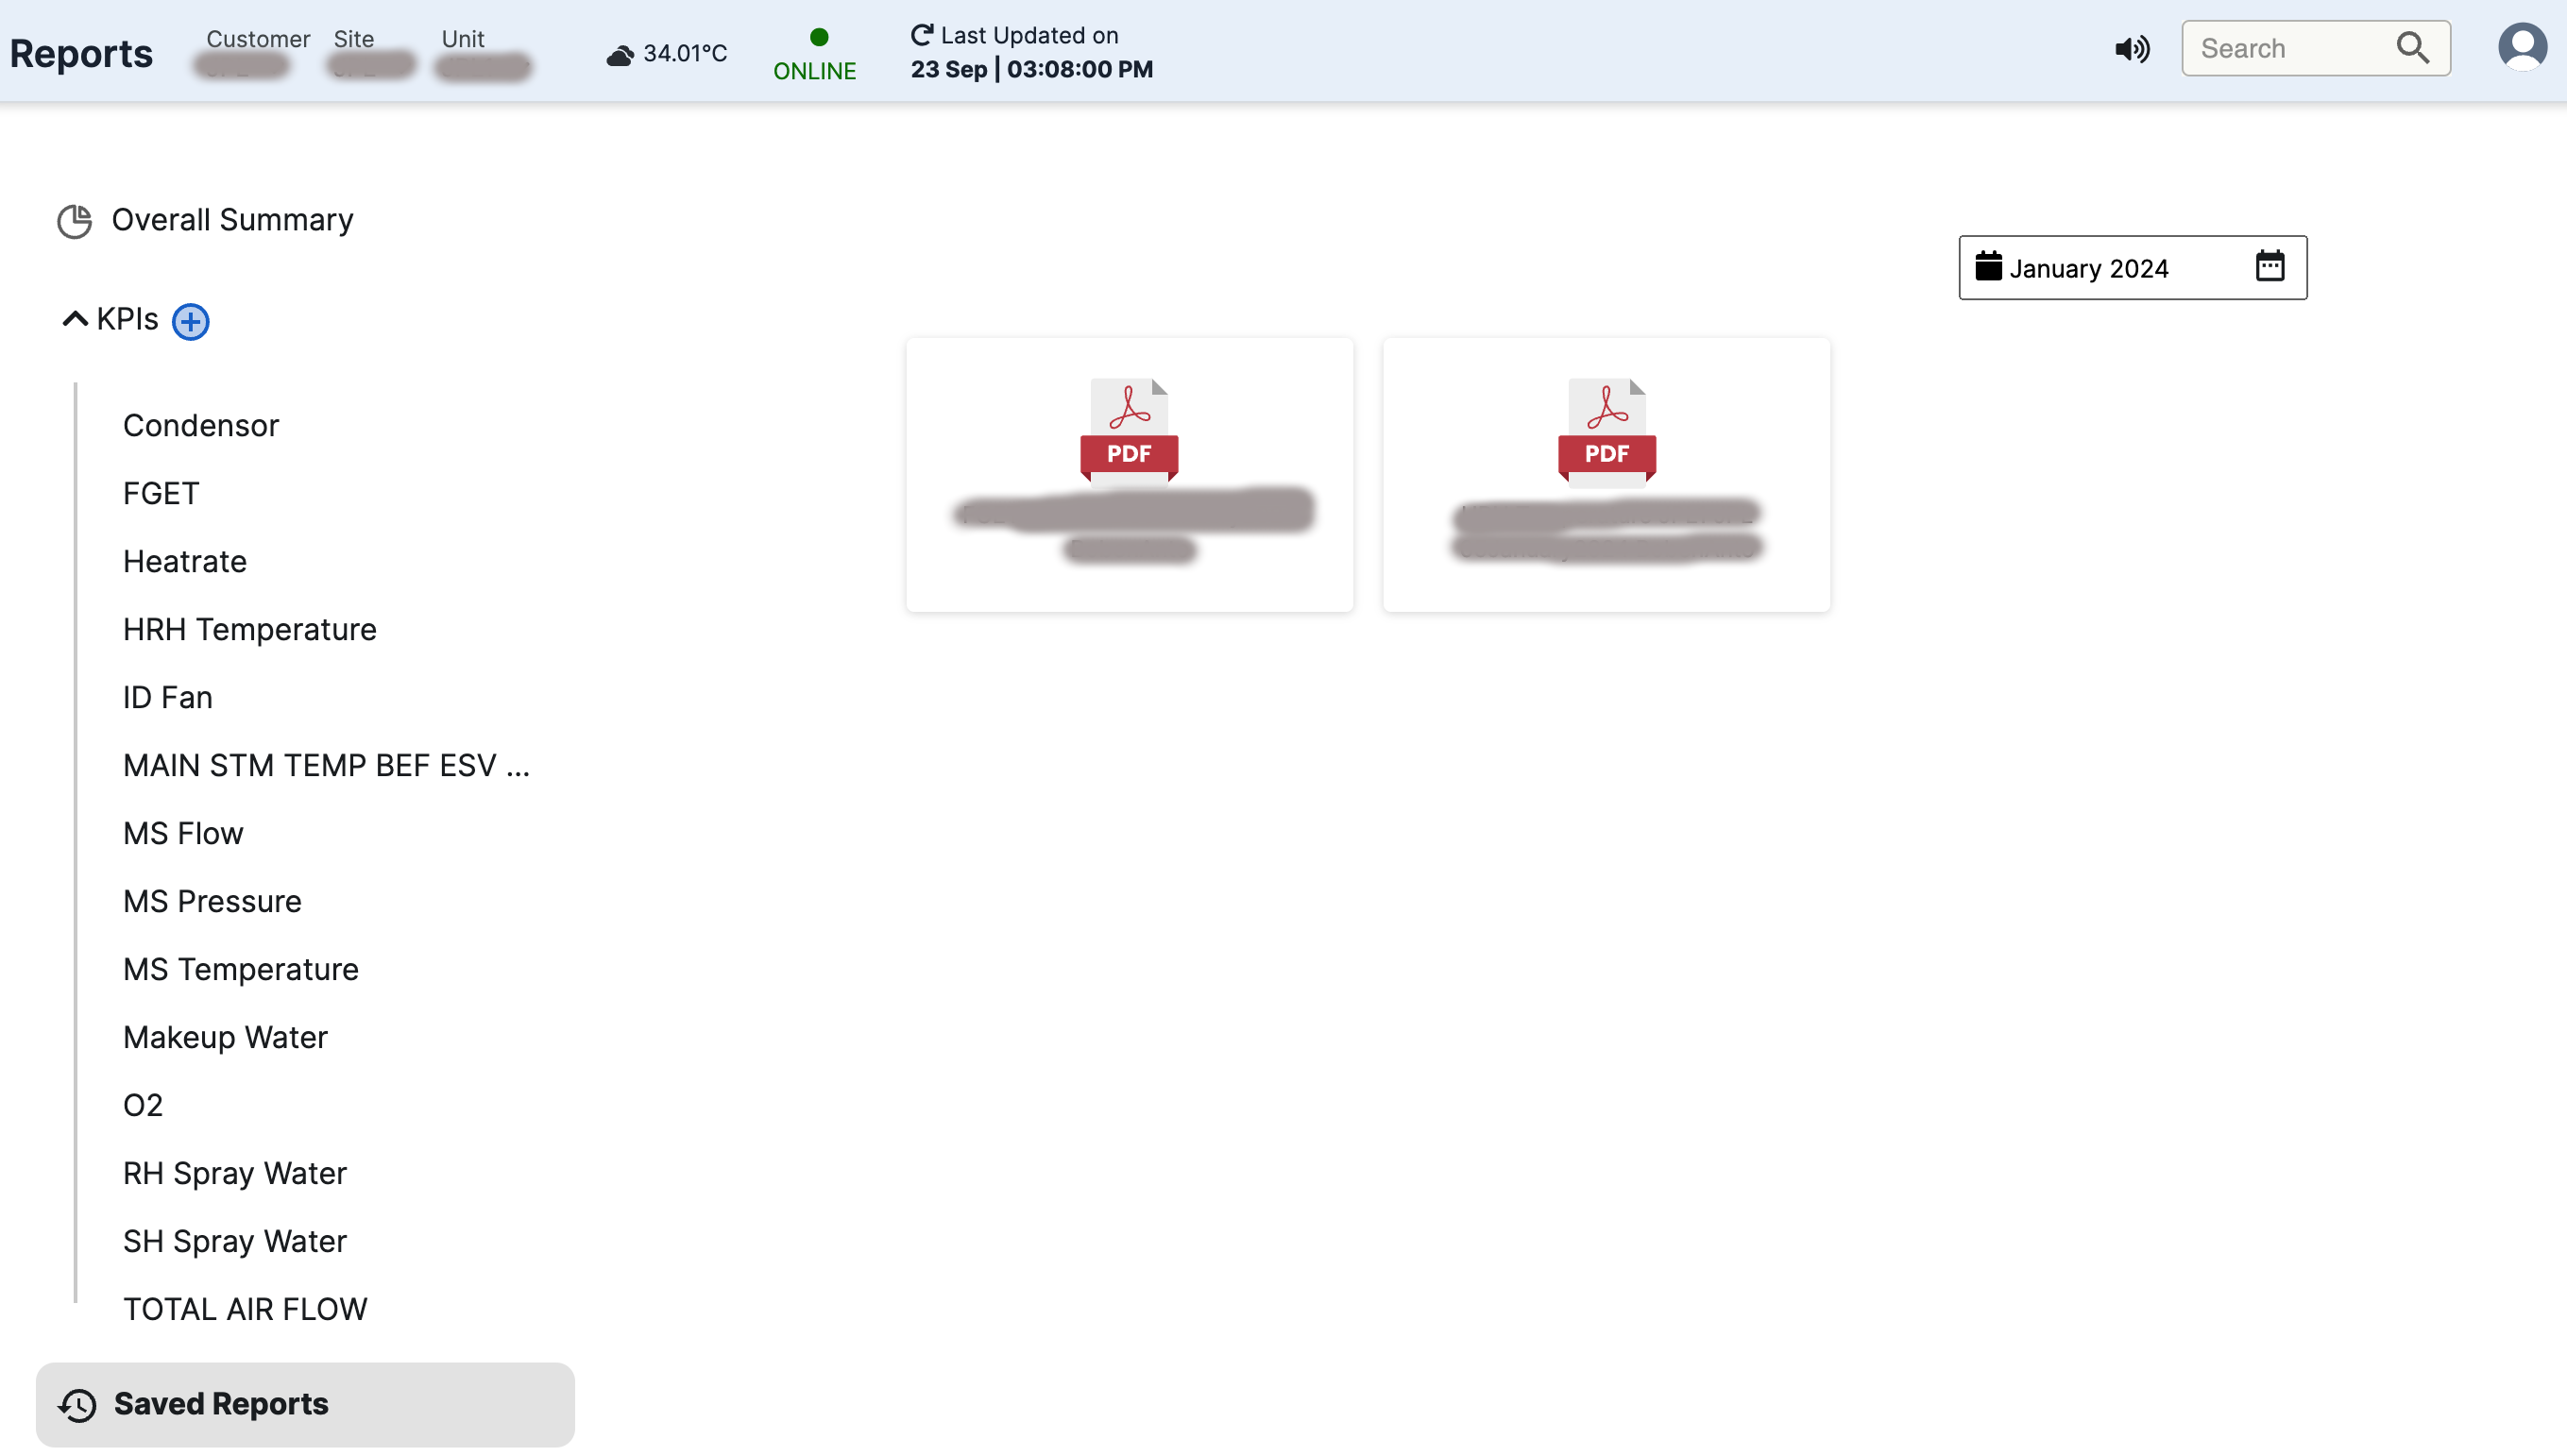
Figure 116. Saved reports
- Click the calendar icon and select a month.
The reports saved for the month appear as PDF files.
- Click a file to view it.