¶ APC (Auxiliary Power Consumption) Management
The APC Manager tool gives a picture of the auxiliary power consumption to the management, that is, the consumption of power by the auxiliary components of main equipment. For example, a boiler. To run, a boiler needs motors, pumps, fans etc that consume power. Suppose the Turbine generates 150 MW power, the auxiliary equipment consumes about 8 to 10 percent of the power generated by the turbine, which is the acceptable usage.
On the APC dashboard at the highest level, the power consumption by a unit is shown and then drills down to the equipment level. This data helps in streamlining the power consumption by identifying the areas of overconsumption.
¶ Viewing APC Details at Unit Level
To view APC details at Unit level:
- Click the APC Manager tab in the Ops Center screen,
The page shown appears.
The histogram displays the daily auxiliary power consumption at the unit level. KW/MW consumed.
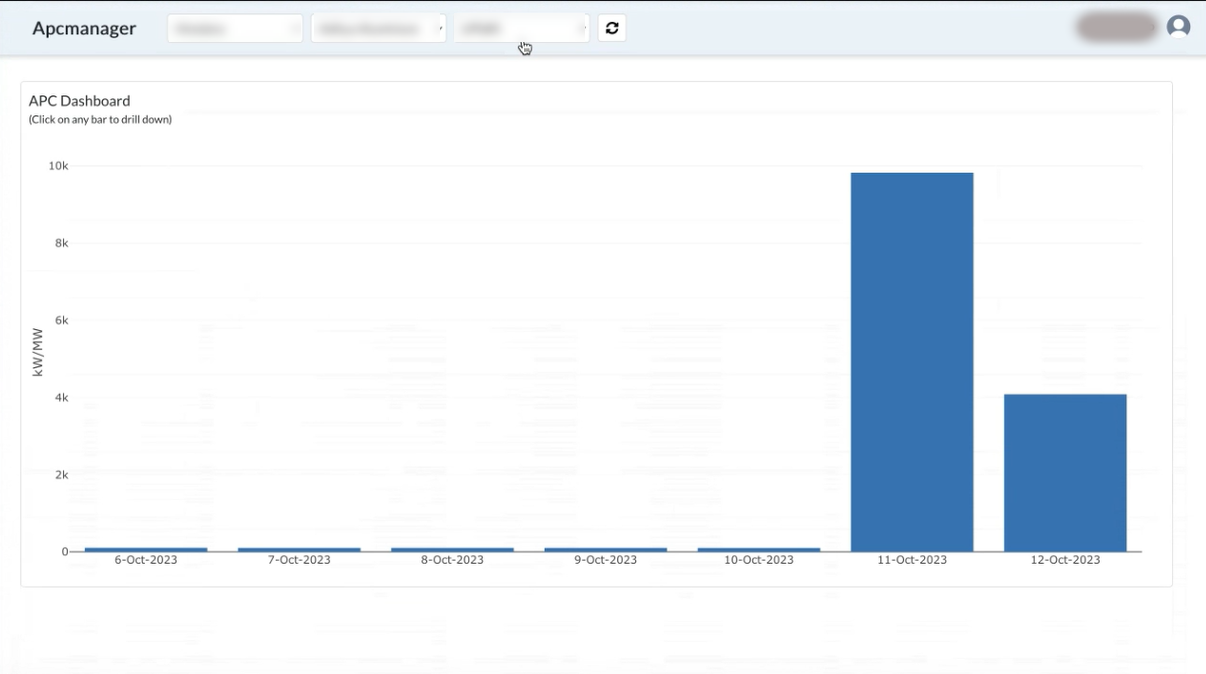
Figure 117. APC manager page
¶ Viewing APC Details at System Level
To view APC details at system level:
- Click a histogram,
The breakdown of the power usage by system is shown.
For example, Fuel Supply System, Condensate cycle System, Bfp System, Cooling Water System, and Pcfb (boiler) System
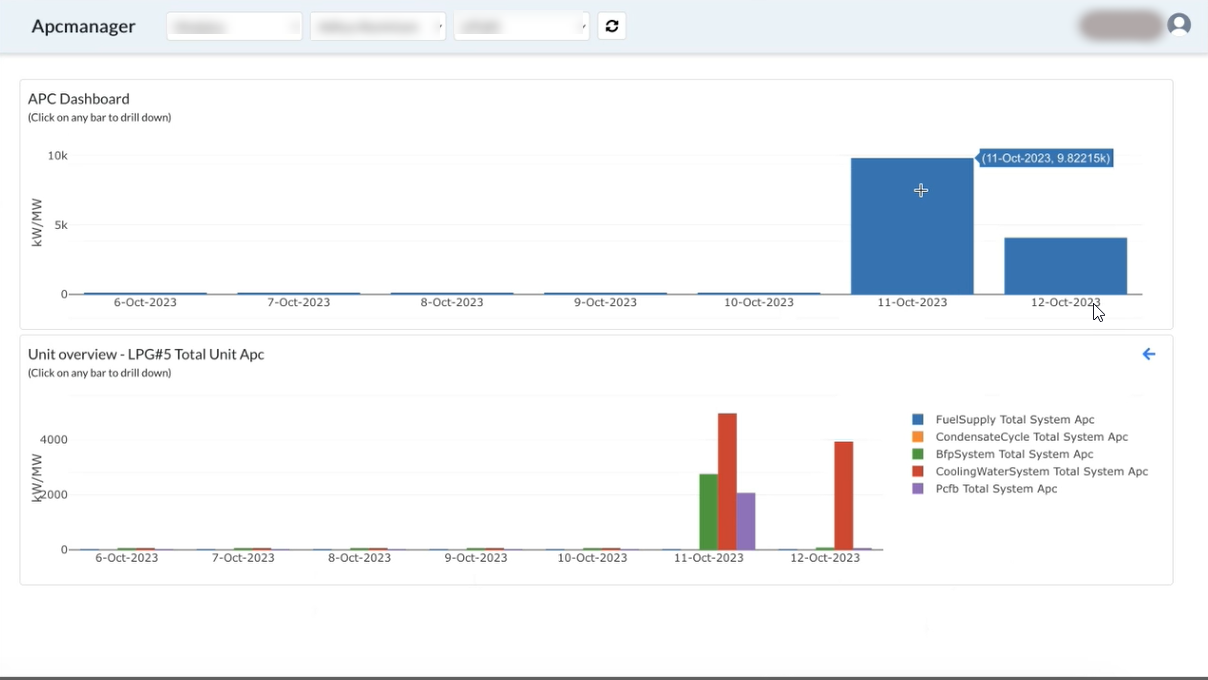
Figure 118. APC Dashboard
¶ Viewing APC Details at Combined Equipment Level
To view APC details at the total equipment level:
- Click a histogram at the system level,
The breakdown of power usage at equipment level is shown.
For example, total consumption by all the fans combined. For example, ACW Pump, Cw Pump, Cooling Tower Fan, Cooling Water Fan, Counter Cooling Water Pump.
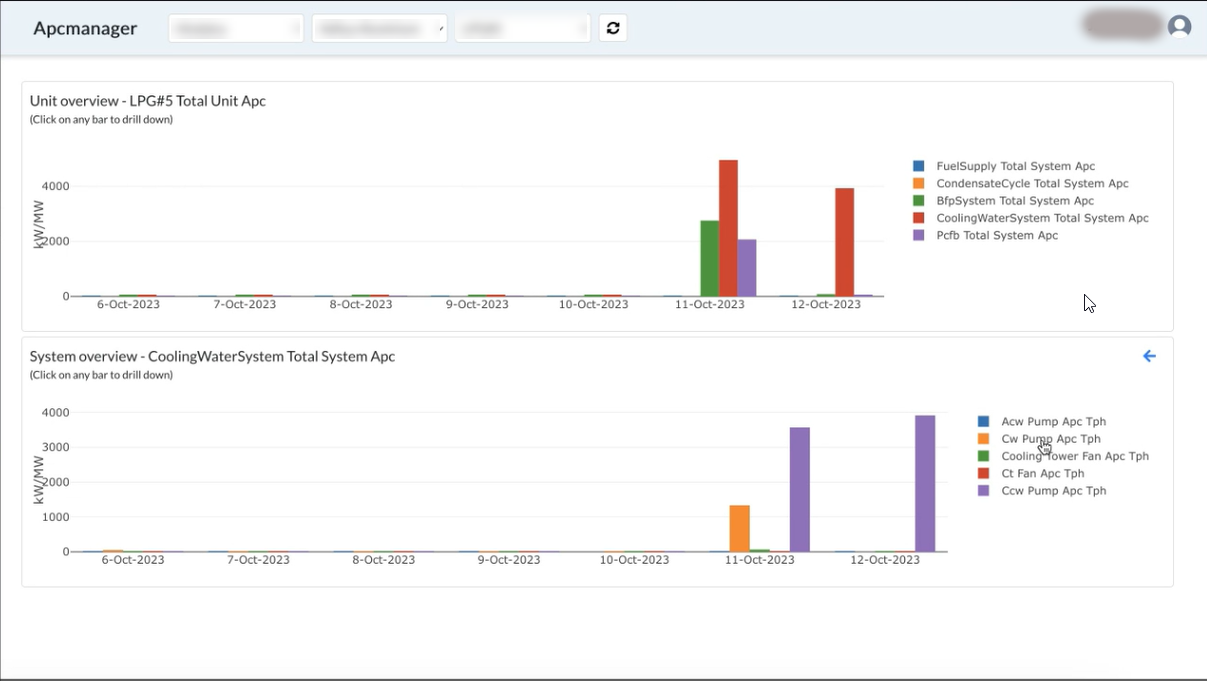
Figure 119. APC details
¶ Viewing APC Details at Individual Equipment Level
To view APC details at individual equipment level:
- Click the total equipment bar in the histogram, the consumption by each equipment is shown in a histogram.
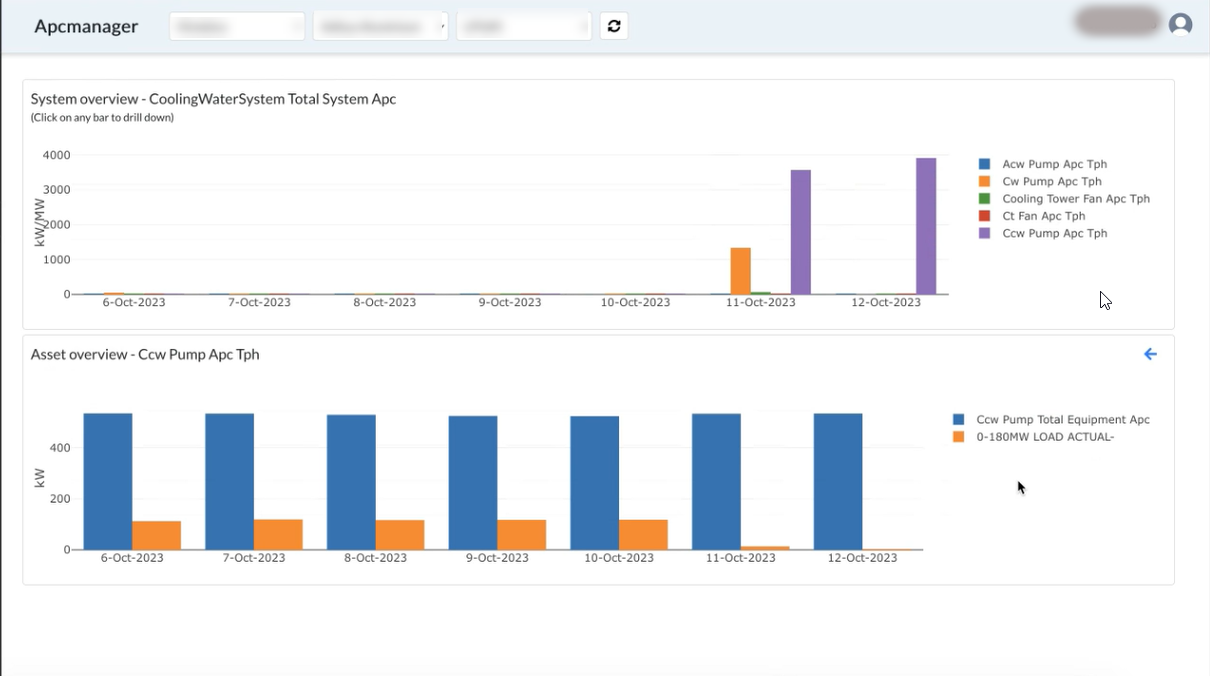
Figure 120. System overview
¶ Viewing APC distribution at sensor Level
To view APC details at sensor level:
- Click an equipment bar in the histogram, the distribution of the power consumed as a result of several parameters is shown.
For example, if the furnace pressure is good, the equipment uses less power and if the furnace pressure is bad it uses more power.
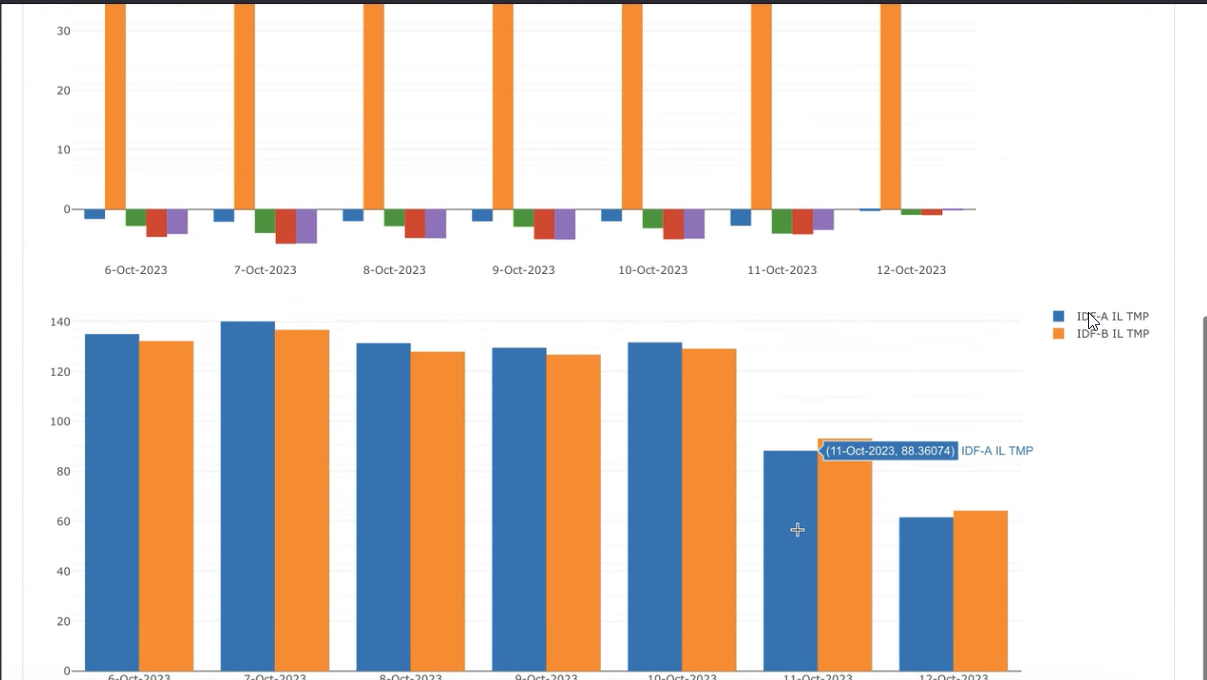
Figure 121. APC overview at sensor level