¶ Incident Details
Incident Details is the default tab of the middle-pane of Incidents page. Here is a brief overview of the various fields that appear in the Details tab.
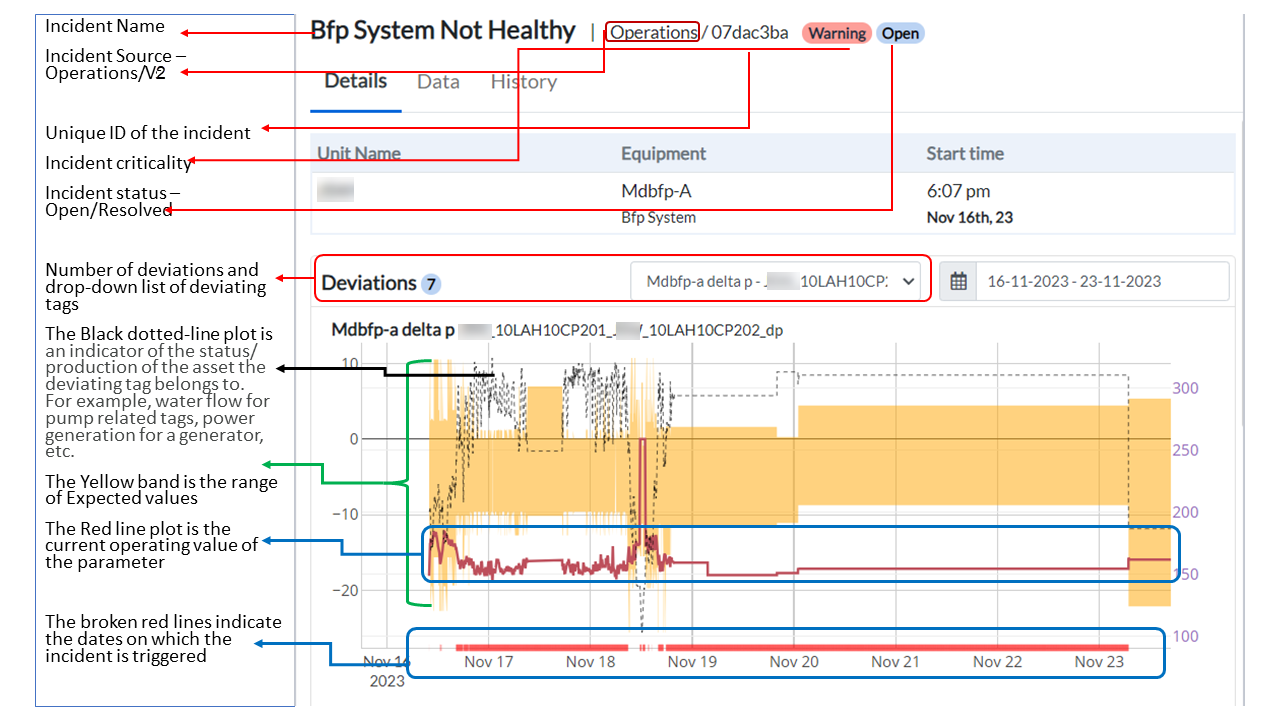
Figure 9. Diagram to show various elements of the incidents page(1)
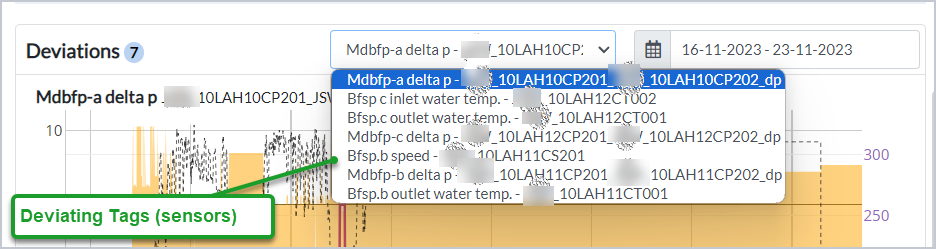
Figure 10. Diagram to show various elements of the incidents page(2)
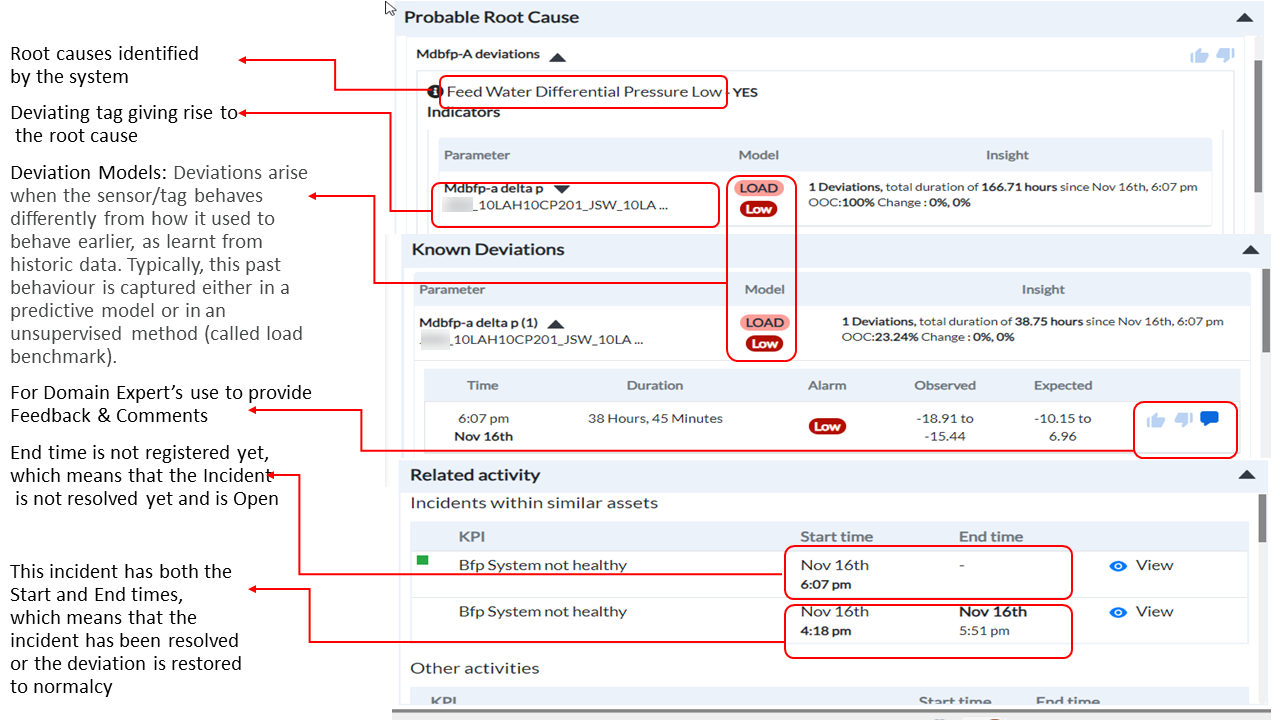
Figure 11. Diagram to show various elements of the incidents page(3)
¶ Viewing Incident Details
To view the details of an incident,
- Select the incident from the Incidents on the left panel. The incident displays in the middle-section of the screen and the Details tab defaults.
The section displays the Unit Name(s) and the Equipment within the unit in which the incident has occurred, and the Start time of the incident.
The number of Deviations displays in parentheses.
Tags that are deviating display in the drop-down list.

Figure 12. Deviation tags
- Scroll-down to view the Known Deviations (in case of Open incidents), Probable Root Cause(s) and Recommended Actions, if any, for these root causes (in case of Resolved ones), Operator Feedback, and view Older Diagnostics, if any.
¶ Probable Root Cause
-
Click the down-arrow beside the Root Cause to view its Indicators. The screen expands to display the indicators
-
the deviating parameters (tags)
-
the status of Alarm (Low or High)
-
the Model (Load,Prediction, or Threshold based)
-
the Observed and Expected values, and the Start and End times.
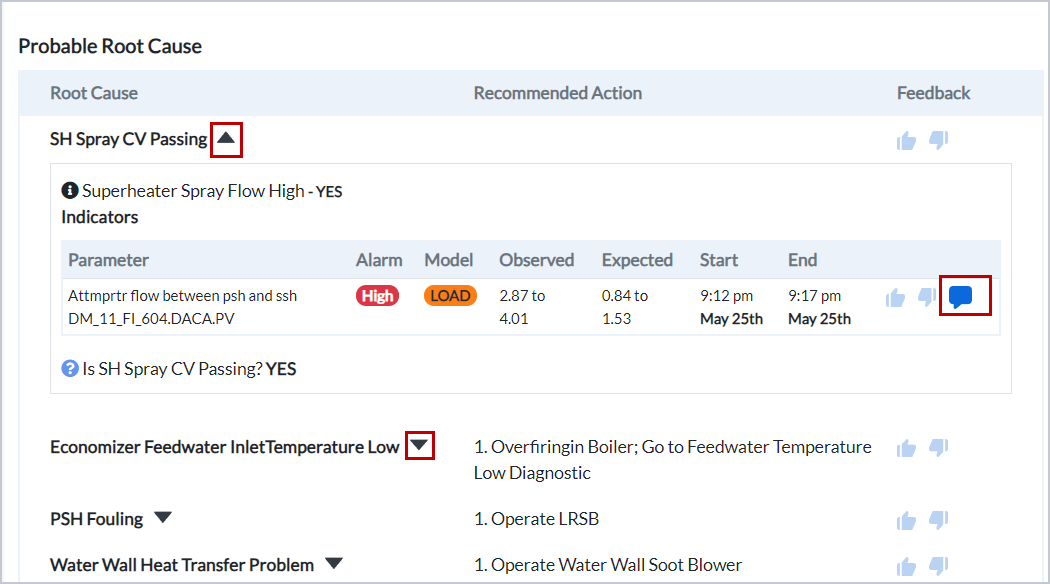
Figure 13. Probable root cause
-
Click the Feedback buttons to accept or reject the probable root cause. The Feedback appears in the Comment popup.
-
Click the Comment icon to enter your Comments, if any.
¶ Known Deviations
The Known Deviations grid displays
-
the deviating parameters (tags)
-
the status of Alarm (Low or High)
-
the Model (Load, Prediction, or Threshold based)
-
the Observed and Expected values, and
-
the Start time of the incident. If the incident has both Start and End times, it indicates that the incident has been resolved and the affected unit is restored to normalcy.
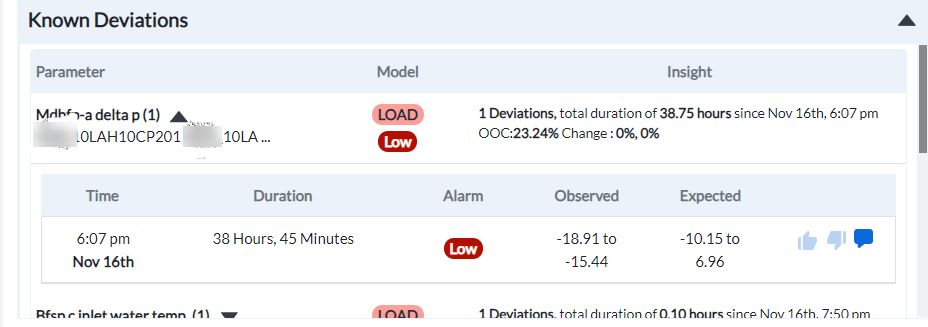
Figure 14. Known deviations
¶ Operator Feedback
- Click the Operator Feedback tab to provide your feedback as an operator. The tab displays various probable root causes for the incident.
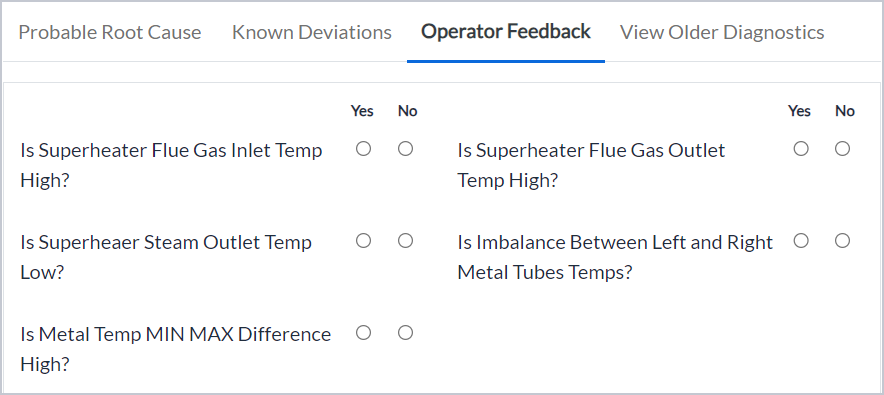
Figure 15. Operator feedback
- Select Yes or No for each one of them by way of your feedback.
¶ View Older Diagnostics
The Older Diagnostics tab displays only for Resolved incidents.
Click the tab to view the older diagnostics for a similar incident to gain insights into resolving such incidents in future.
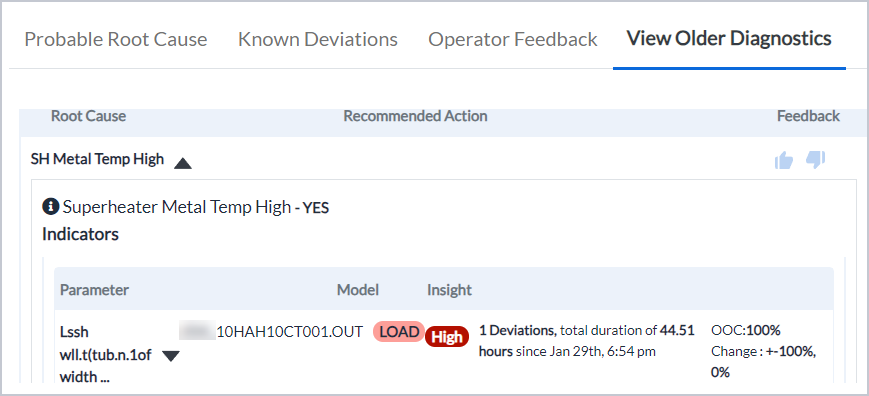
Figure 16. View older diagnostics
¶ Related Activity
The Related activity section of the screen displays the mechanism through which the incident is generated. Other incidents in the same system (Open or Resolved) are also displayed.
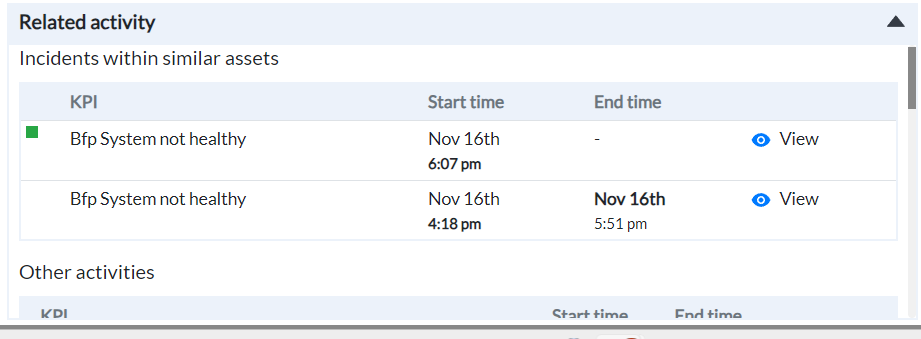
Figure 17. Related activity
¶ Viewing Incident Data
The Data tab shows all the deviating tags that have contributed to the incident. The page displays the individual graphs of both "Expected Value" and "Observed Value" for each of the deviating tags.
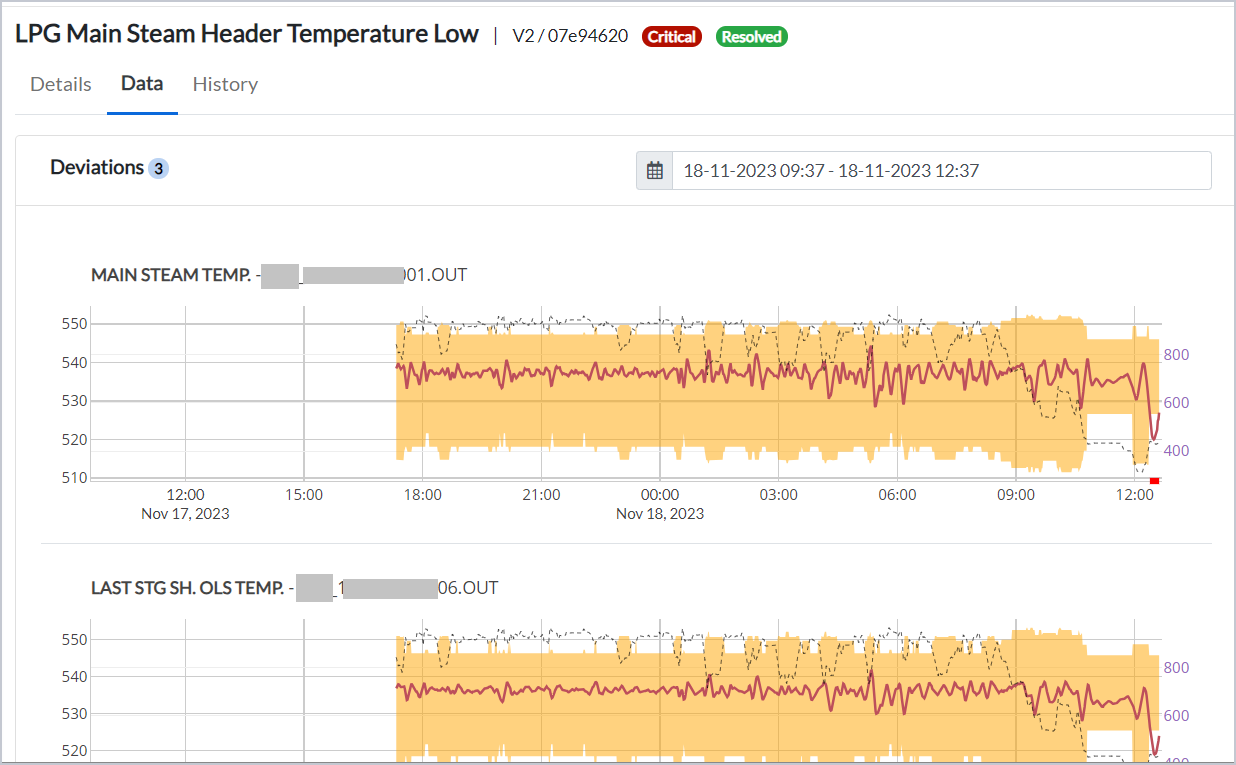
Figure 18. Expected value and observed value
¶ Viewing Incident History
The History tab displays the record of previous occurrences of the same incident along with their respective time frames.
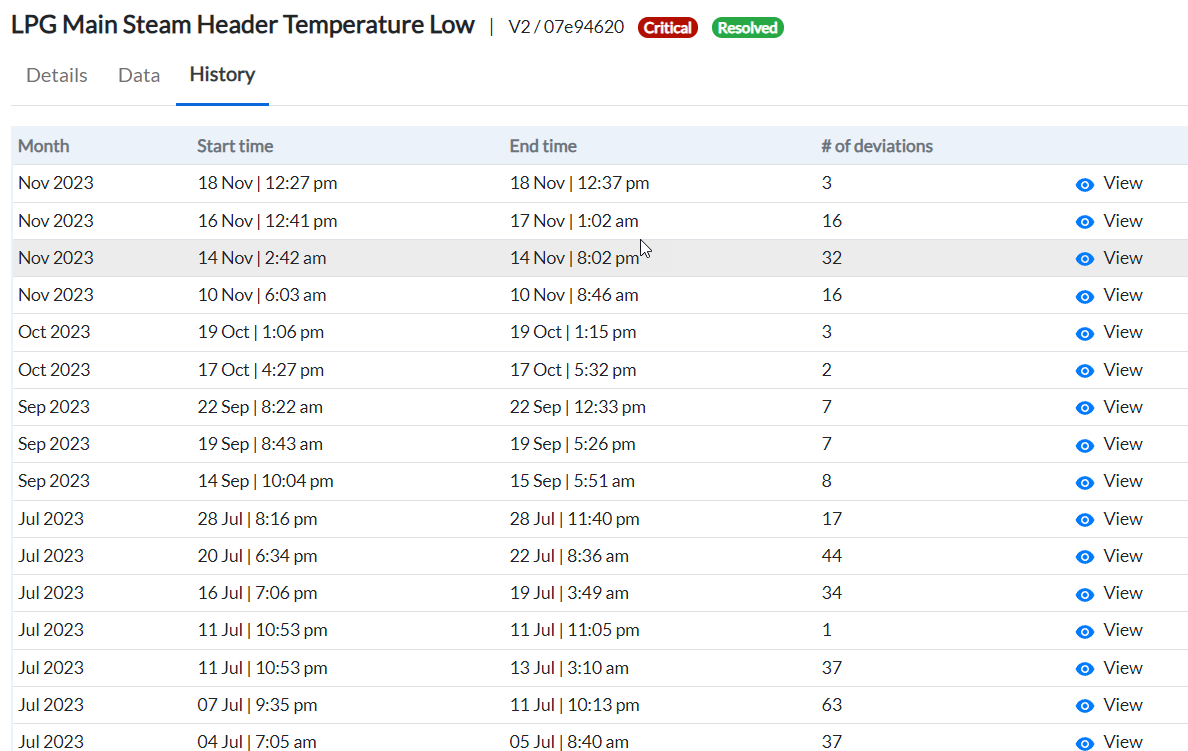
Figure 19. Incident history
- To view any of the past incidents, click the view icon of the respective incident.
¶ User Actions and Comments
The right panel of the Incidents page consists of two tabs - Actions and Comments.
The Actions tab allows the users to provide feedback pertaining to an incident, which may be of help to further improve system accuracy.
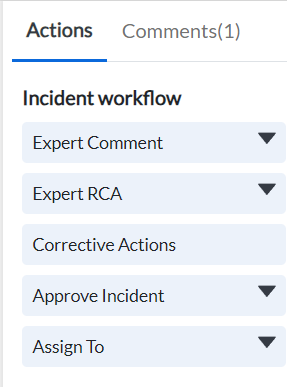
Figure 20. Actions tab
The Incident Workflow section of Actions tab allows:
-
Domain experts to submit their comments related to the selected incident
-
Domain experts to submit Root Cause Analysis related to the selected incident
-
Domain experts to add Corrective Actions carried out
-
Operator to approve the incident
-
Operator to assign the selected incident to a user
¶ Incident Workflow
¶ Adding Expert Comments
-
Click the down arrow beside Expert Comments. The section expands to display a text-box.
-
Enter your comments in the text-box for this incident. These comments will be sent to the customer.
-
Click Submit.
¶ Adding Expert RCA
-
Click the down arrow beside Expert RCA. The section expands to display a text-box.
-
If the system has not identified any root cause, enter your detailed feedback of the actual fault identified at the site.
-
Click Submit.
¶ Suggesting Corrective Action
- Click Corrective Actions, the Correction Actions pop up displays.
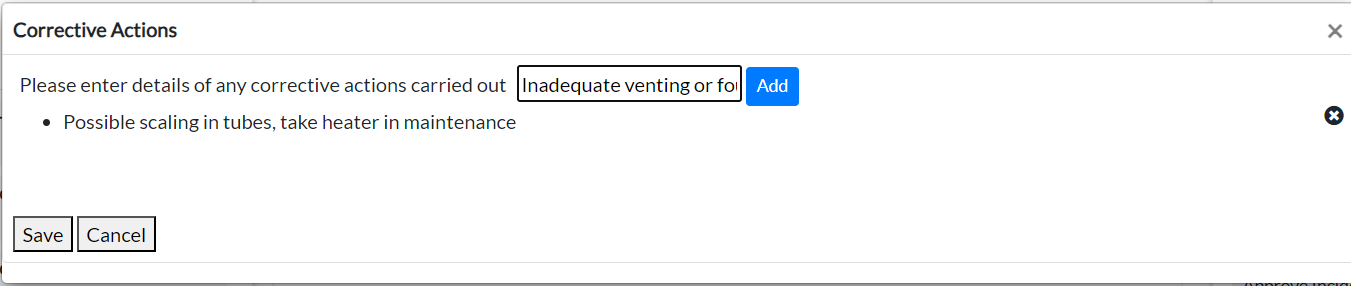
Figure 21. Corrective actions
-
Enter the details of corrective actions you have carried out.
-
Click Add.
-
Click Save. The application seeks confirmation to save the corrective actions for the incident.
-
Click Confirm.
¶ Approving an Incident
-
Click the down arrow beside Approve Incident. The section expands to display the Submit and Cancel buttons.
-
To acknowledge that the incident has caught significant deviation, click Submit.
¶ Assigning an Incident
-
Click the down arrow beside Assign To. The section expands to display the Search box.
-
Click in the box, the platform displays a list of users.
-
Select the user, and click Assign.
¶ Adding Comments with or without Attachments
-
Click the Comments tab.
-
Enter your message.
-
Click the Add a file icon to attach relevant file(s), if any.
-
Click the send arrow.
¶ Adjusting Incident Sensitivity
Let us understand the graphical representation of incidents in the Incident page.
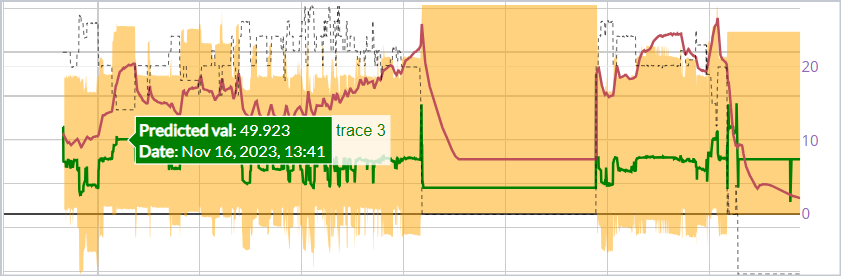
Figure 22. Incident graph
The yellow band is the range within which the system expects the parameter values to be. The Black dotted line is an indicator of the status of the asset the deviating tag belongs to. The red line plot is the current operating value of the particular parameter. If the current operating value exceeds or falls below the yellow band by a certain defined value and for a particular period of time, the system reports this as an incident.
The Adjust incident configuration section of Actions tab allows you to adjust the parameters that trigger deviations within an incident.
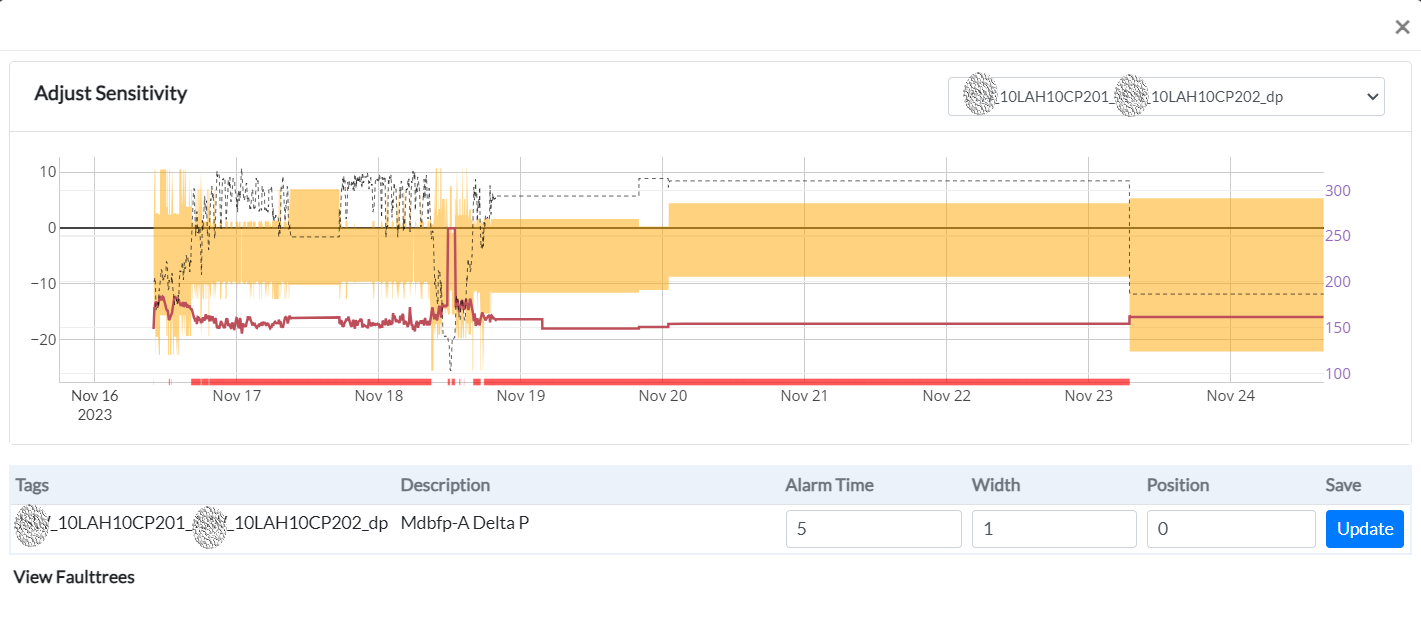
Figure 23. Adjust sensitivity window
-
Select the tag from the drop-down list. The tag description, alarm time, width, and position details display.
-
Make the required changes to
-
Alarm Time (# of consecutive minutes for which the tag must be outside the expected range before creating a deviation)
-
Width - this is the width of the yellow band, or the range of the expected parameter values. By default, this is 1. Increasing beyond 1 expands the expected range and decreasing below 1 (and >0) shrinks the expected range by that factor.
-
Position - This is an offset to shift the entire expected band above or below. Typically used if there is a shift in operating values of a parameter after an overhaul/maintenance activity.
-
Click Update.
¶ Rating Incident Criticality
Select the criticality of the incident based on your perception of the severity of the incident, with respect to the system-rated default criticality. The options are:
-
Critical - if the incident needs to be attended to immediately without delay
-
Warning - if the incident needs to be attended to immediately though not on priority
-
Deviation
¶ Pinning and Unpinning an Incident
You can pin an incident if it is of interest and would like to continue watching it over time. This helps creating a ‘favorites’ or shortlist of Incidents To do this,
-
Select the incident you wish to pin.
-
Click the Pin Incident icon. The incident will be listed under Pinned tab
To unpin an incident,
-
Go to the Pinned tab and select the incident. The incident details display in the middle panel.
-
Click Unpin Incident at the bottom right.
¶ Adding/Removing an Incident from Noise
Incidents you have identified as false alarms or irrelevant are added to the noise section. This is feedback to the modeling team to see if any changes in the model are required.
To add or remove an incident to/from Noise,
-
Select the incident.
-
Click the Add to Noise icon. The incident will be added to the Noise tab.
To remove the incident from noise,
-
Go to the Noise tab and select the incident.
-
Click Remove from Noise icon at the bottom right.
¶ Sharing an Incident
To share the incident to other users of the platform,
-
Select the incident.
-
Click the Share Incident icon at the bottom right. The Share Incident popup displays.
-
Enter the email IDs separated by a comma (if you wish to share to more than one user).
-
Click Share.
-
To copy the link, click Copy Link.
The link is copied to your clipboard.