¶ Configure Asset
Configuring an asset is defining and setting it up within a system to enable monitoring, predictive analysis, and fault detection. Assets must be assigned models and defined parameters to ensure continuous tracking and diagnostics, integrated with data sources, and linked to fault trees.
This page in Pulse helps users analyze their assets by providing a comprehensive view of all asset-related details in one place. This allows for efficient monitoring, quick troubleshooting, and better decision-making based on real-time insights.
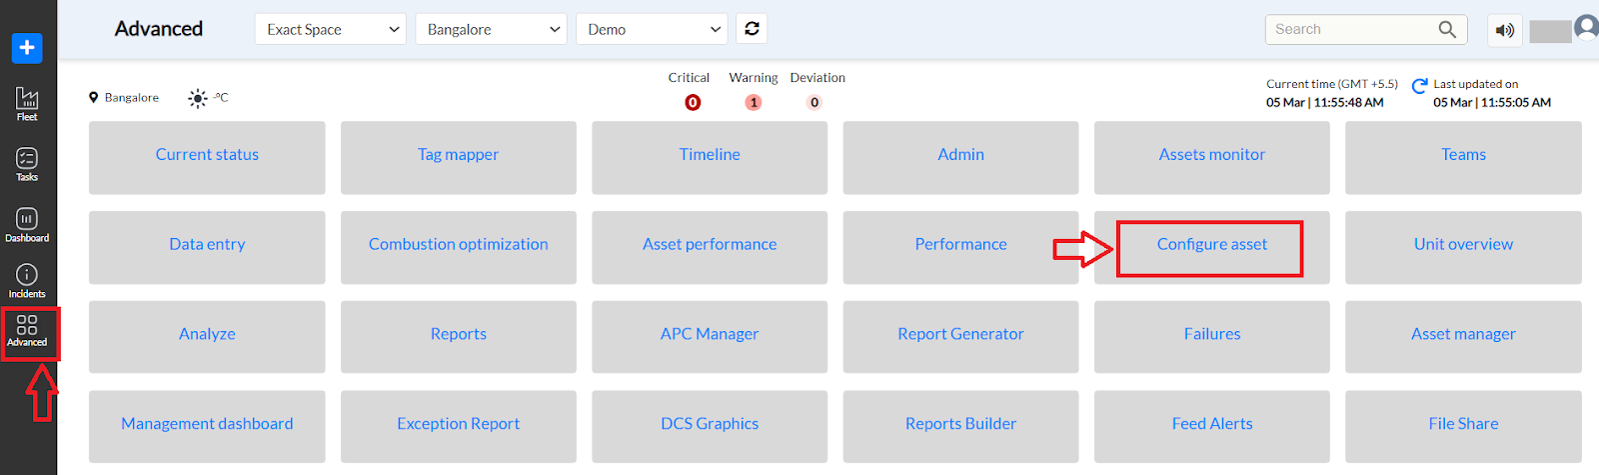
Figure 1. Pulse Advanced page
To access the Configure Asset Page in Pulse,
Step1. Log in to Pulse with the correct credentials
Step2. Click on the Advanced tab on the left panel
Step 3. Click on Configure Asset from the list of modules. The user will be redirected to the Configure Asset page of Pulse as shown in Figure 2.
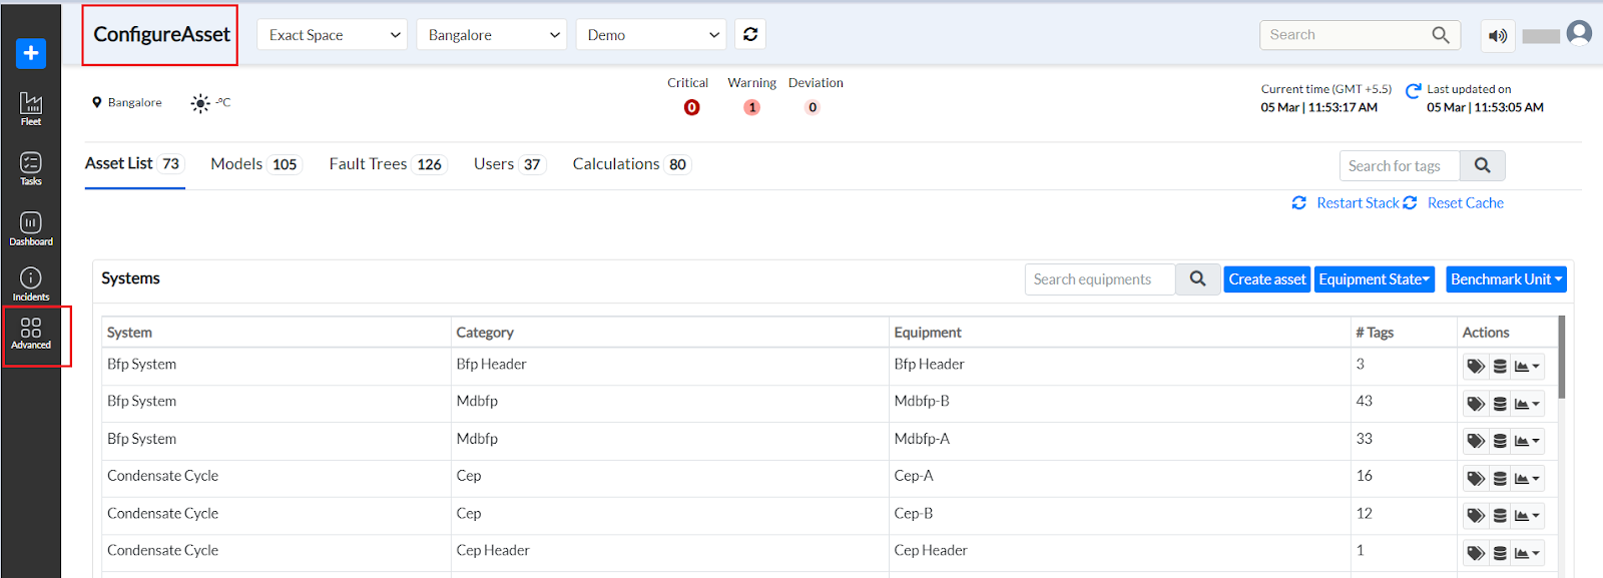
Figure 2. Pulse- Configure Asset
Header Section
- Dropdown Menus - Three dropdowns allow users to select:
- Company (ExactSpace) - Select the organization.
- Location (Bangalore) - Select the site.
- Environment (Demo) - Choose the operational mode.
- Refresh Button (⟳) - Updates the displayed data to show the latest model status.
- Location & Temperature Display - Displays the selected location and its real-time temperature (if available).
Critical, Warning, and Deviation Indicators [Refer to Figure 3]
- Critical (Red - 0) - Shows the number of severe issues.
- Warning (Orange - 4) - Displays less severe alerts.
- Deviation (Grey - 0) - Indicates any unexpected behavior detected by models.
Navigation Tabs
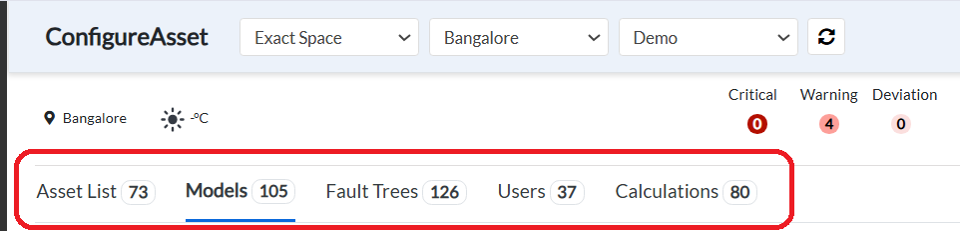
Figure 3. Navigation Tabs on the Configure Asset page - **Asset List (73)** - A list of assets being monitored. - **Models (105)** - Displays all machine learning models deployed for asset monitoring. - **Fault Trees (126)** - Shows structured fault diagnosis trees. - **Users (37)** - Lists users who have access to the system. - **Calculations (80)** - Displays calculated metrics and values used in the analysis.
Search Bar

Figure 4. Search bar
A search input field is available to search for models quickly.
Let us understand the detailed explanation of the features this page offers.
¶ 1. Asset List
The Assets List feature in the configure asset page of Pulse provides an all-in-one interface for managing industrial assets efficiently. It allows users to:
- Add new assets
- Monitor equipment status
- Set benchmark values
- Analyze sensor data
- Restart and refresh configurations
Buttons and Their Functions on the Asset List
¶ 1.1 Search for Tags / Search Equipment
- This search bar enables users to quickly locate specific tags or equipment within the asset list.
- Users can enter keywords related to the asset, equipment, or system they are looking for.

Figure 5. Asset List
¶ 1.2 Restart Stack

- Clicking this button reloads the current asset configuration and ensures the latest updates are applied.
- Changes made in the database, if any, are not effective on real-time data. To ensure these changes are effective on real-time data, click Restart Stack.
- It is useful when changes such as new assets, sensors, or fault trees are added but not yet reflected in the system.
- It prevents the need for a full system restart while ensuring data consistency.
¶ 1.3 Reset Cache
- This button clears stored temporary data related to assets and tags.
- It is useful when users suspect outdated or incorrect data is being displayed.
- Resetting the cache ensures that the latest real-time data is fetched from the backend.
¶ 1.4 Create Asset
Clicking on this button opens a form to add a new asset (system/equipment/component).
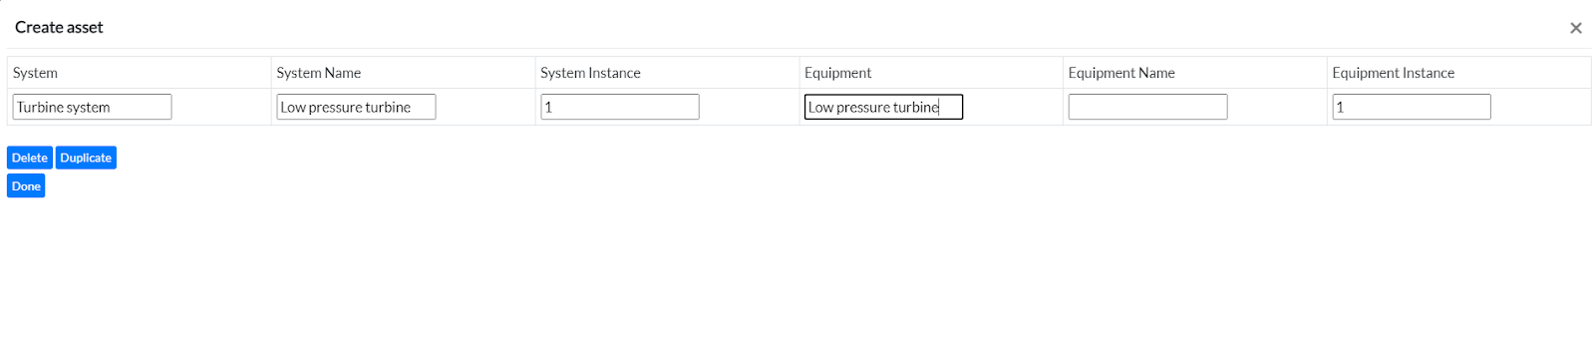
Figure 6. Create an asset
- Users must enter details like:
- System Name
- System Instance
- Equipment Name
- Equipment Instance
- Click on “Done” to submit the asset. The new asset gets added to the Asset List.
- Click on “Delete” to delete this asset or “Duplicate” to create a duplicate of this asset.
¶ 1.5 Equipment State
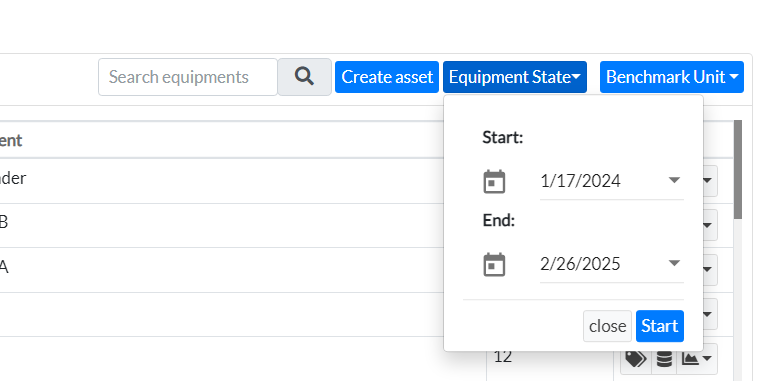
Figure 7. Equipment State
To view the status of the asset during a selected period,
- Click Equipment State. A popup displays, showing Start and End Datepickers.
- Select a past date from the Start date picker and an end date from the End date picker.
- Maximum previous 1-year data can be selected from the date range.
- Click Start. The application starts generating the equipment's status, and the progress is displayed at the top. This is useful for analyzing past performance and identifying trends or anomalies.
¶ 1.6 Benchmark Unit
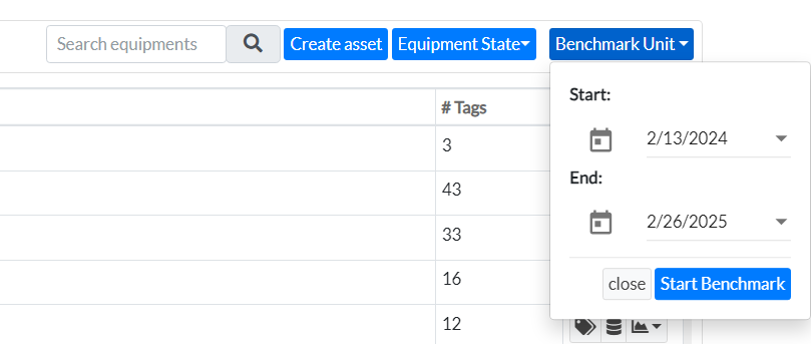
Figure 8. Benchmarking Unit
- Benchmarking is used to set optimal operating conditions for an asset based on historical data.
- Clicking this button allows users to:
- Set benchmark values at the Unit, Asset, or Tag level.
- Compare current sensor data with historical trends.
- Improve performance monitoring and anomaly detection.
To set the benchmarks at the unit level,
- Click the Benchmark Unit button at the top right of the Asset List. The Benchmark popup displays
- Select a past date from the Start datepicker and an end date from the End datepicker.
- Click on “Start Benchmark” to initiate benchmarking. At the top, a message stating that the process has been completed will be displayed.
¶ 1.7 Tags
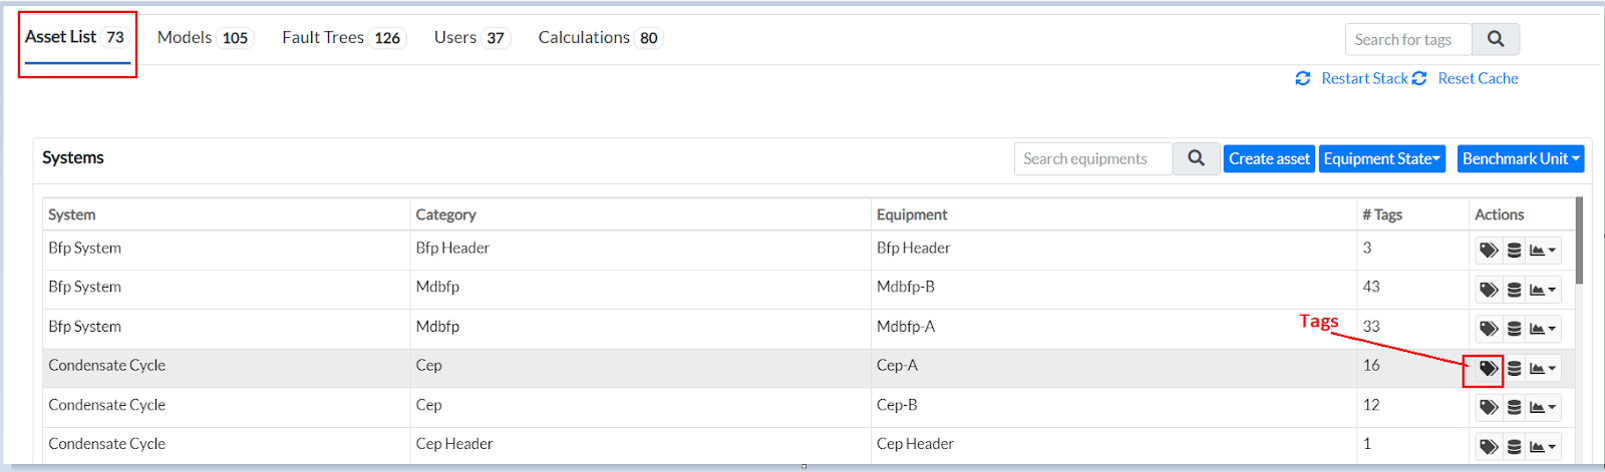
Figure 9. Tags in Asset List
Click the Tag icon for the particular system you want to view the assigned individual tags. A list of tags assigned to the asset displays. This screen allows you to:
- View or modify the details of the tag.
- Set the benchmark for the tag.
- View the benchmark and history of benchmarking for the tag.
- View graphical data point plots of the tag.
- Create a smart alarm for the tag.
- Add the tag for monitoring its performance.
- View the last known statuses of benchmarking, equipment, data validity, alarm load, and alarm model.
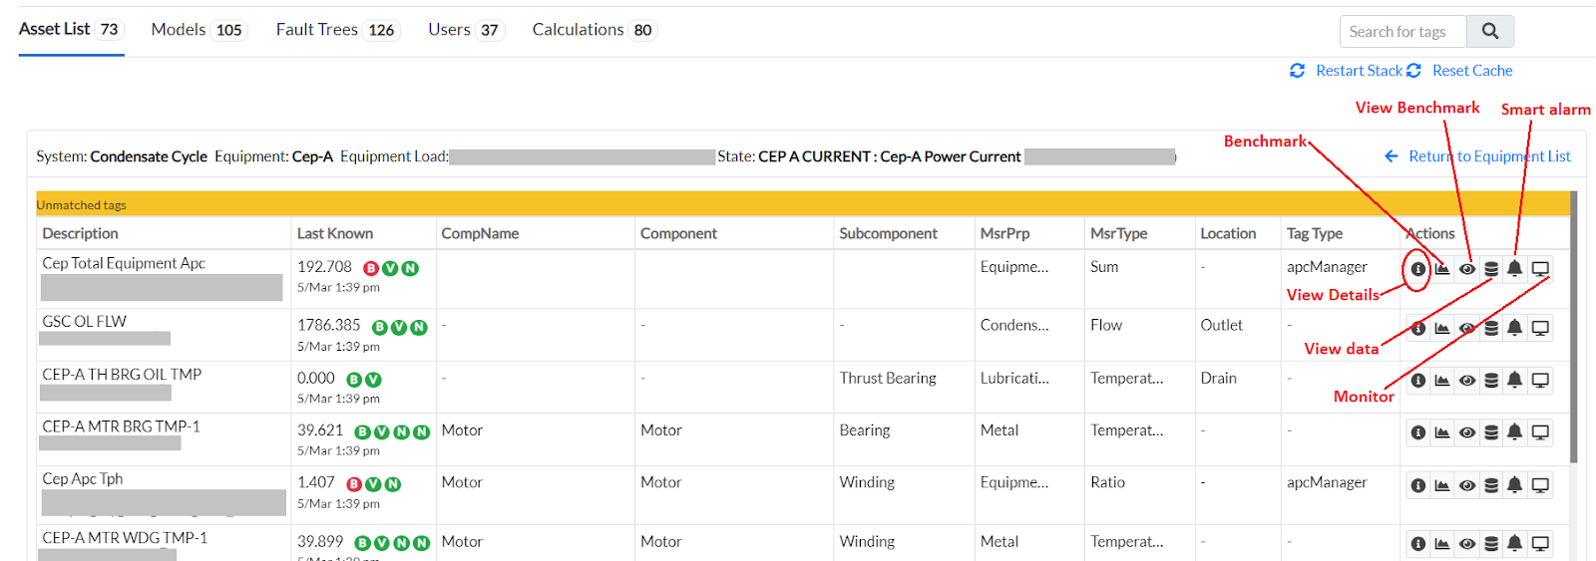
Figure 10. Detailed View of Tags in the Asset* List **Viewing Last Known Status**
The Last Known column displays the Benchmarking, Equipment, Validity, Alarm Load, and Alarm Model status of the tags.
Note: Alarm Load: Every tag will be benchmarked based on historically available values and checked against these values to determine whether it is above or below its "normal operational range." If the tag lies within this range, the Alarm Load is considered Normal and would be proportional to the flag load values.
Whereas the values for the Alarm Model are based on predictions or models that are built. If the values of the tags that have models built are within the normal operational range, the Alarm Model is deemed to be Normal.
Given below are the statuses:
B - Benchmarking of the tag. It is either Green (completed) or Red (not completed).
E - Status of the Equipment. It is Green (running) or Red (tripped).
V - Data validity. It is either Green (valid) or Red (invalid). Valid data fluctuates within the threshold limits and is never constant, even when the equipment is in running condition.
Alarm Load is displayed as follows:
- H in Red color - High Alarm Load with high severity, with flag load being 3.
- H in Orange color - High Alarm Load with medium severity, with the flag load being 2.
- H in Yellow color - High Alarm Load with low severity, with flag load being 1.
- L in Red color - Low Alarm Load with high severity, with flag load being -3.
- L in Orange color - Low Alarm Load with medium severity, with flag load being -2.
- L in Yellow color - Low Alarm Load with low severity, with flag load being -1.
- N in Green color - Normal.
Alarm Model - N in Green color - Normal.
Actions Column (Icons)
Each row in the Asset List has multiple action buttons that allow users to perform specific tasks on individual assets:
View Details
- Clicking this icon opens a detailed view of the selected asset, showing all associated tags and metadata.
- Edit the information and click on “Save” to submit.
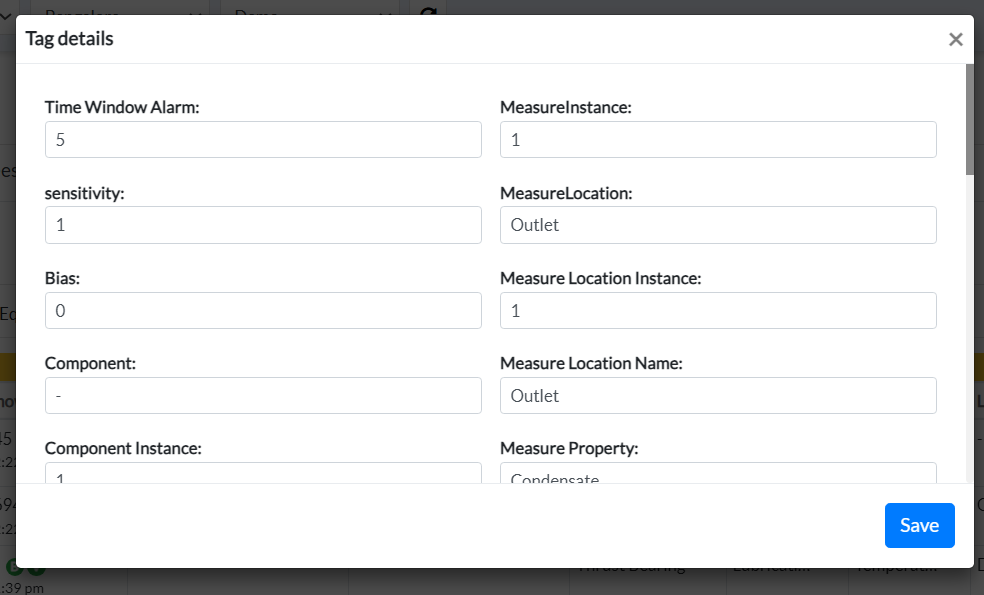
Figure 11. Tag Details
- Benchmark at Tag Level
The benchmarking option allows the user to create a benchmark at the “tag level.” Select the “Start” and “End” times, followed by the “Start Benchmark” button.
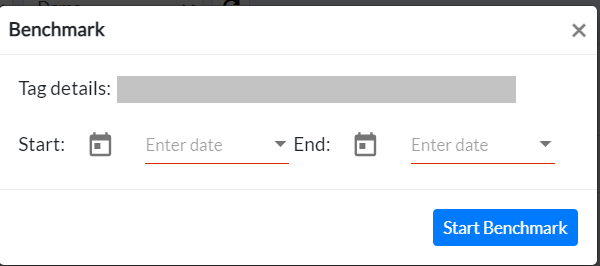
Figure 12. Benchmark at Tag level
- View Benchmark
To view the benchmarking and benchmarking history of a tag, click the View Benchmark icon. The View Benchmark popup displays.
- The Expected range of values is calculated based on historical data. When real-time data goes below or beyond this range during a specific time (it could be minutes or seconds, depending on the frequency of data), an alert is generated, and a deviation is recorded. Through Benchmarking, the expected range of values is calculated using the median and standard deviation. Bias is the two extremes of the normal range. If the alerts generated are not too critical, increasing the bias will overlook such unwanted alerts.
- Click the View History link at the bottom left side of the popup. The popup expands to show the past benchmarking of the tag.
- Clicking on the “View” button ahead of Fault Trees under benchmarking redirects the user to the Fault Tree creation page.
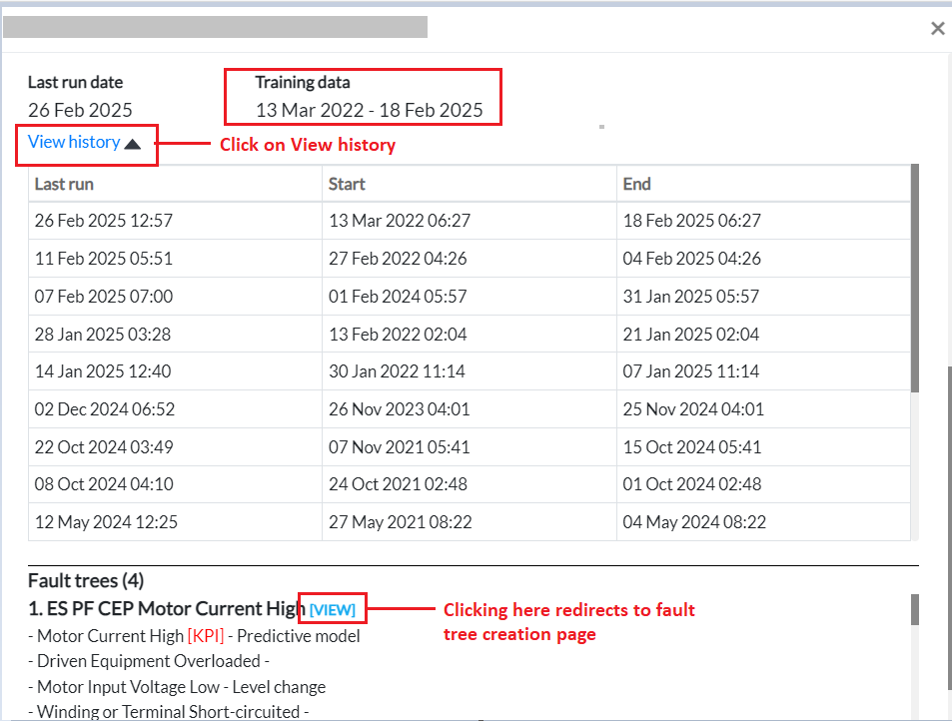
Figure 13. View History
- View Data-
Clicking on the “View Data” option opens a compact window displaying a detailed graphical representation of the data for the selected tag. Users can customize the period from the top-right corner, choosing from options such as 1 day, 1 week, 1 month, 3 months, 6 months, 1 year, or 5 years.
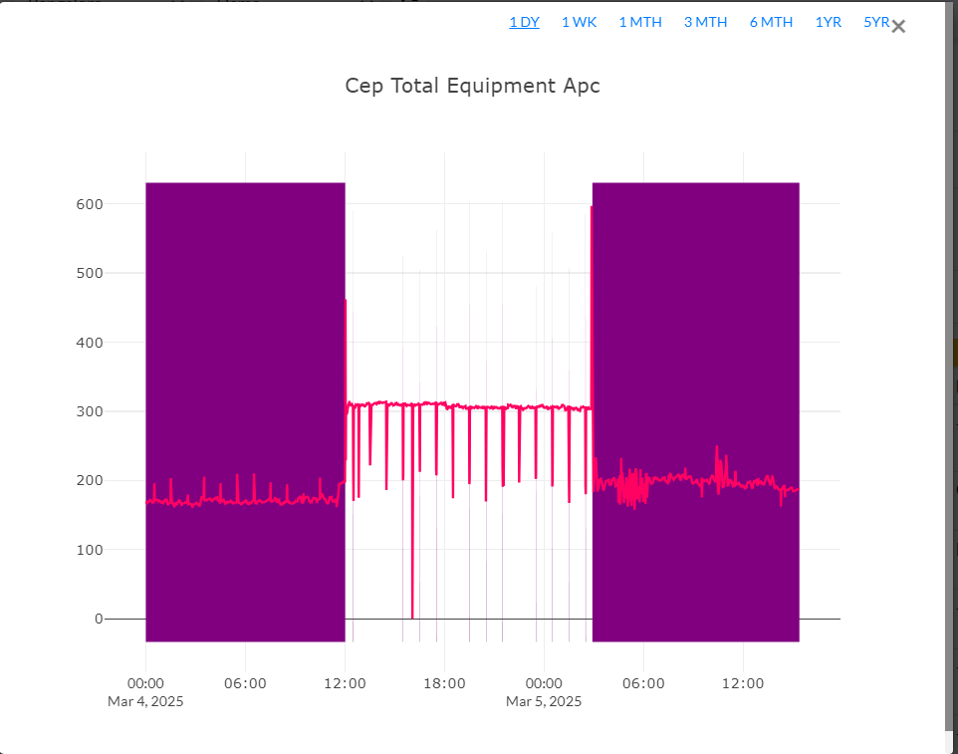
Figure 14. View Graph details
- View Benchmark
To view the benchmarking and benchmarking history of a tag, click the View Benchmark icon. The View Benchmark popup displays.
- The Expected range of values is calculated based on historical data. When real-time data goes below or beyond this range during a specific time (it could be minutes or seconds, depending on the frequency of data), an alert is generated, and a deviation is recorded. Through Benchmarking, the expected range of values is calculated using the median and standard deviation. Bias is the two extremes of the normal range. If the alerts generated are not too critical, increasing the bias will overlook such unwanted alerts.
- Click the View History link at the bottom left side of the pop-up. The pop-up expands to show the past benchmarking of the tag.
- Clicking on the “View” button ahead of Fault Trees under benchmarking redirects the user to the Fault Tree creation page.

Figure 15. View History
- View Data-
Clicking on the “View Data” option opens a compact window displaying a detailed graphical representation of the data for the selected tag. Users can customize the period from the top-right corner, choosing from options such as 1 day, 1 week, 1 month, 3 months, 6 months, 1 year, or 5 years.

Figure 16. View Graph details
- Smart Alarm- A smart alarm is for creating fault trees with High and Low alarms. It will not have a proper fault tree with proper diagnosis. It just contains symptoms with Low and High alarms. Like an anomaly incident, the incident will be generated from fault trees rather than an anomaly incident.
Note: The Smart alarm feature is not currently working in Pulse
- View Graph
- Displays graphical representations of sensor (tag) data over a period.
- Helps in trend analysis and fault detection.
- Manage Data Sources 🗄️
- Opens a menu where users can view, edit, or add data sources linked to the asset.
- Essential for ensuring continuous data integration from industrial sensors.
- More Options ⏬
- Clicking this dropdown provides additional asset-specific actions such as modifying configurations, deleting assets, or linking fault trees.
Note: Click on Return to Equipment list to go back to the asset list page
¶ 1.8 Data
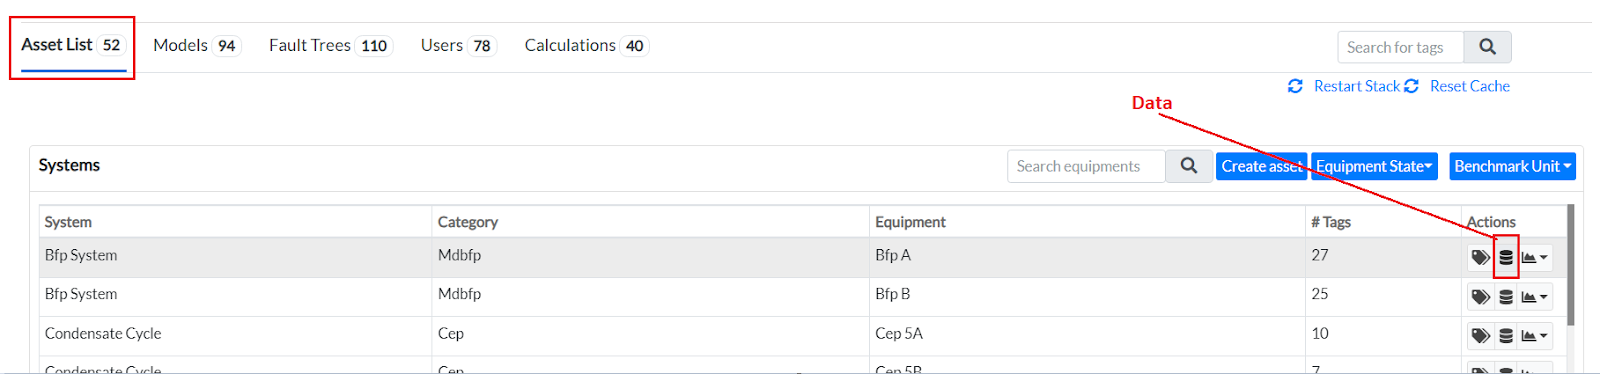
Figure 17. Data in Asset List
Next to "Tags" on the Asset List page, there is a "Data" option. Clicking this button opens a new window displaying a graph and detailed information about the actual load and time for the selected asset. Users can choose the data range they want to view, selecting from 1 day, 1 week, 1 month, 3 months, 6 months, 1 year, or 5 years. The user can click anywhere on the graph to see the detailed value at that particular point.
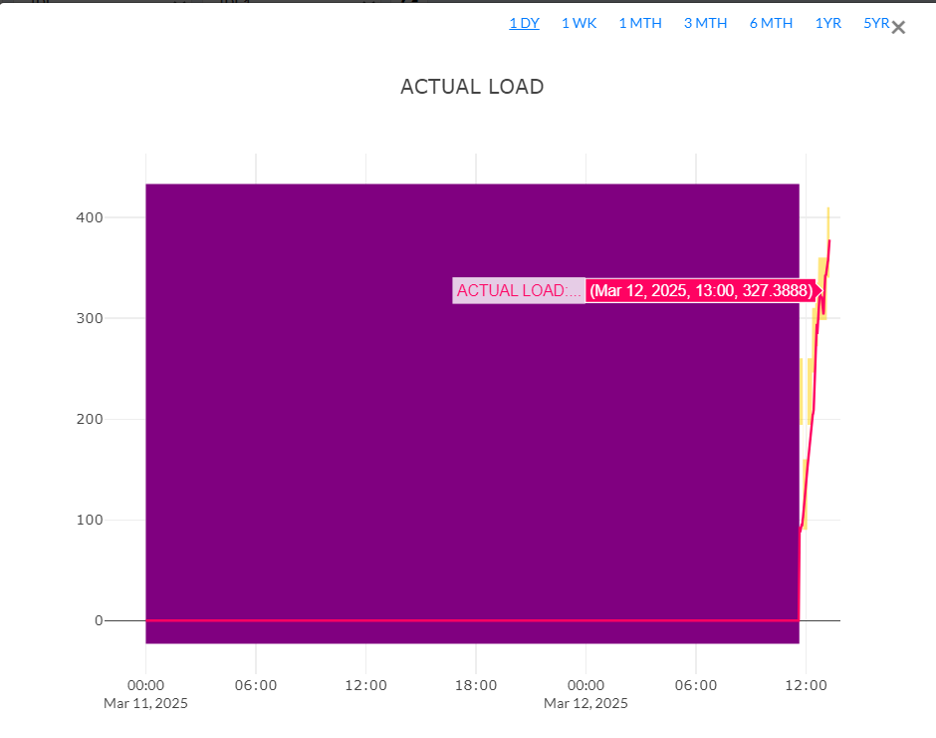
Figure 18. Graph of Actual load changes with time
¶ 1.9 Benchmarking at Asset level
Next to data on the Asset list page is the Benchmark option, where the user can do benchmarking at the asset level.
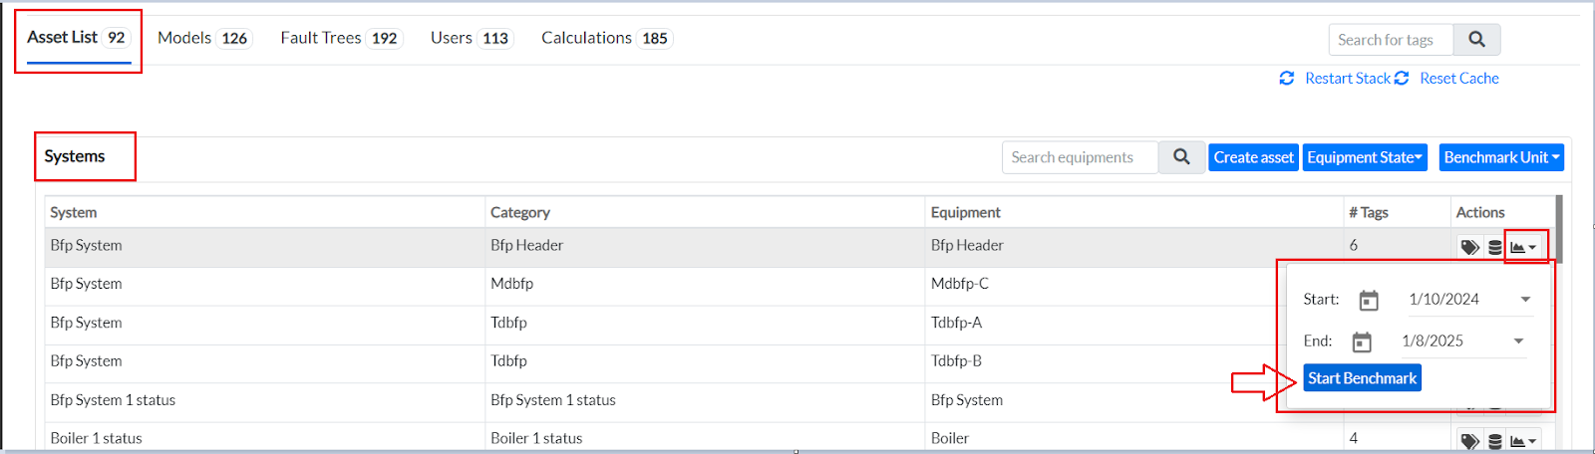
Figure 19. Benchmarking at* the *Asset level
Clicking the "Benchmark" button allows the user to select a Start and End date for benchmarking. After choosing the desired time, the user can click "Start Benchmark" to initiate benchmarking at the asset level.
Note: In Pulse, users can perform benchmarking at the unit level, system level, and tag level. Each type of benchmarking is explained in detail in this document.
¶ 2. Models
¶ 2.1 Overview
The Models page in the ConfigureAsset application provides an overview of deployed machine learning models, their performance metrics, input-output mappings, and deviation tracking. This document explains all the buttons and features on the page.
¶ 2.1. Table Section
The table presents details of deployed models for each tag for that particular site and unit. It gives us the input tag used for a particular output tag and the model type applied on those input tags with the calculated R2 and RMSE score to analyze how well the model fits with the data values. It also gives the version number deployed for that model, along with a graphical representation of the values and number of deviations for different time frames. Users can efficiently review all relevant information on a single screen, enabling better analysis of modeling details and associated tags.
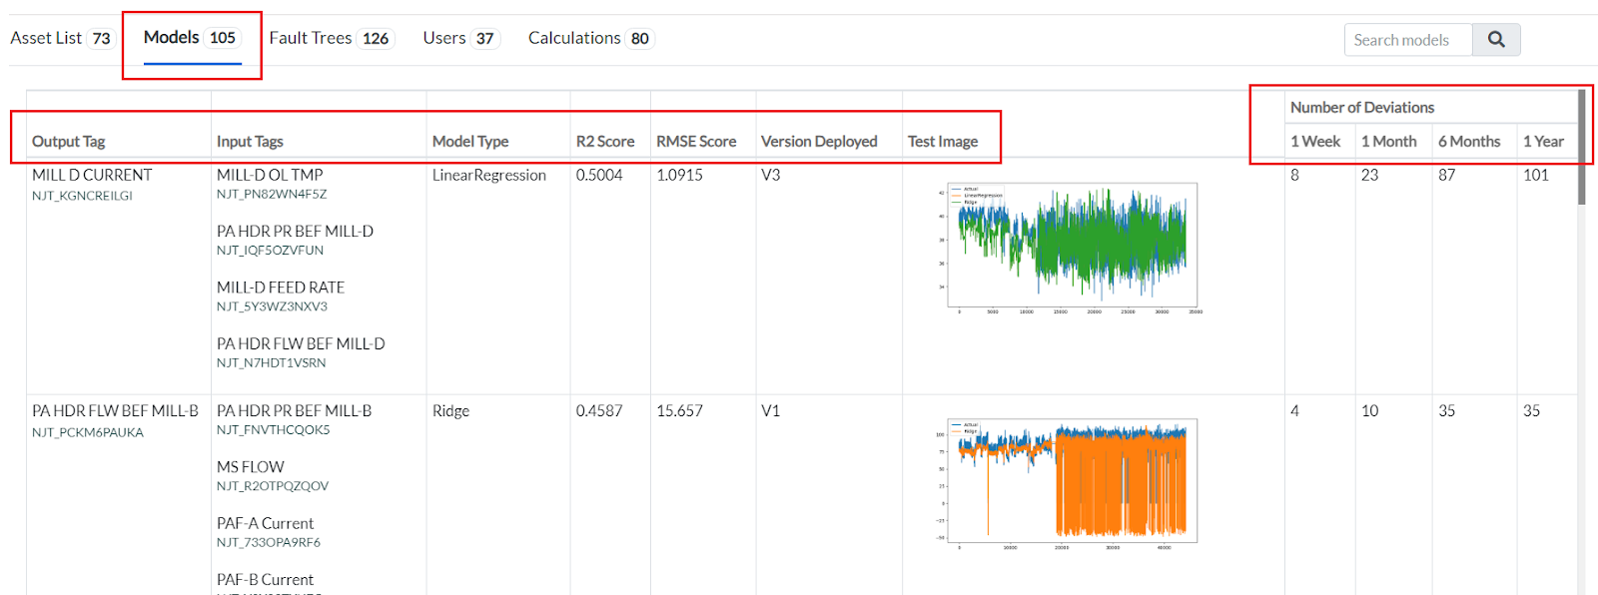
Figure 20. Models in Configure Asset
Each column represents some information, which is described below-
- Output Tag- Shows the monitored output parameter (e.g., MILL D CURRENT).
- Input Tags - This shows the list of sensor parameters used as input for the model.
- Model Type - Specifies the algorithm used (e.g., Linear Regression, Ridge Regression, and more).
- R2 Score - The goodness-of-fit metric evaluates how well a model aligns with the observed data. It quantifies the model’s accuracy in capturing patterns and relationships within the dataset.
- RMSE Score - Root Mean Square Error, gives the prediction accuracy.
- Version Deployed - Indicates the active model version, i.e., the latest version of the deployed model.
- Test Image - A small graph showing actual vs. predicted values. The graph is color-coded for easy and better understanding.
- Number of Deviations - List deviation counts over different time frames:
- 1 Week
- 1 Month
- 6 Months
- 1 Year
¶ 3. Fault Trees
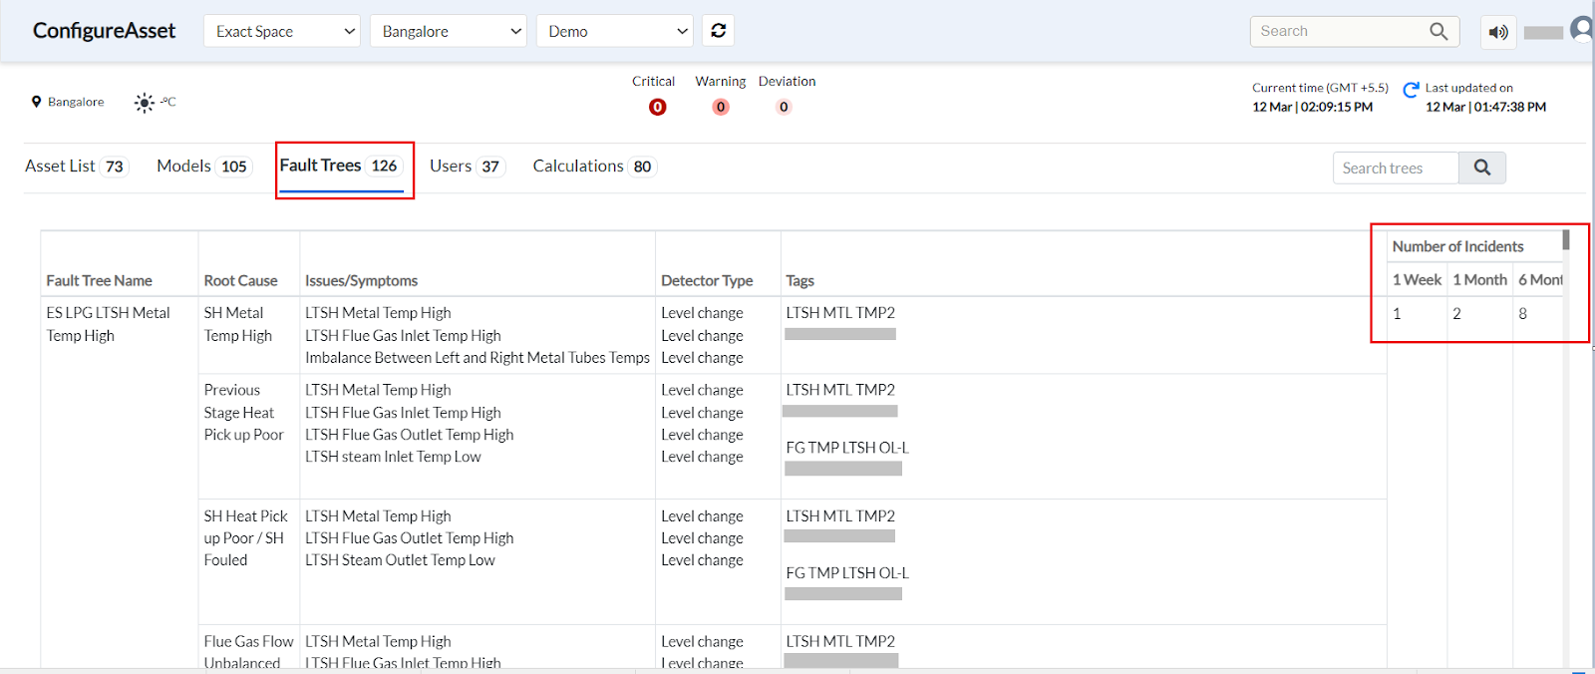
Figure 21. Fault Trees in Configure Asset
¶ 3.1 Page Overview & Purpose
This module under Configure Asset provides a Fault Tree Analysis interface. It allows users to track and analyze fault trees, their root causes, symptoms, detector types, and incident trends. This helps the user to diagnose issues, monitor trends, and make data-driven decisions to improve system reliability.
¶ 3.2 How This Page Helps Users
- Proactive Issue Identification – Helps engineers and operators detect and analyze faults early.
- Root Cause Analysis – Quickly identifies underlying issues causing failures.
- Historical Trend Monitoring – Tracks fault occurrences over time to assess long-term reliability.
- Data-Driven Decision Making – Supports predictive maintenance strategies to reduce downtime
¶ 3.3 Search Function (Top Right of Fault Tree Section)
- A search bar labeled "Search trees" allows users to quickly find specific fault trees.
¶ 3.3 Fault Tree Table (Main Section – Left to Right, Top to Bottom)
This table provides structured insights into fault trees and their characteristics:
- Fault Tree Name – Describes the type of issue detected (e.g., "ES LPG LTSH Metal Temp High").
- Root Cause – Highlights the underlying cause of the fault (e.g., "SH Metal Temp High").
- Issues/Symptoms – List associated symptoms, such as metal temperature imbalance.
- Detector Type – Specifies the detection method (e.g., "Level change").
- Tags – Contains metadata tags for tracking and classification.
- Number of Incidents (1 Week, 1 Month, 6 Months, 1 Yr) – Shows how frequently this fault has occurred over different time frames.
¶ 4. Users
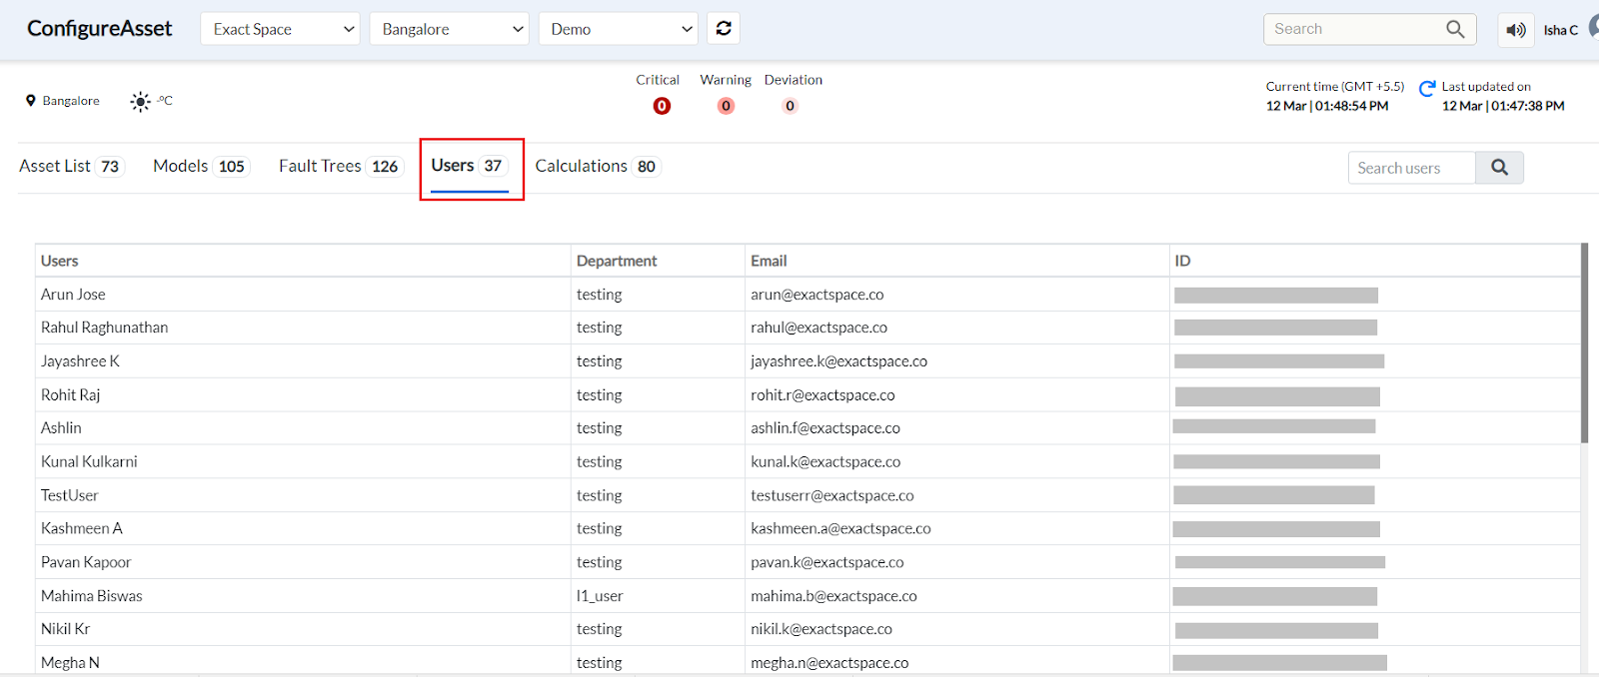
Figure 22. User's page in Configure Asset
Clicking on the Users option on the Configure Asset page displays a list of all users who can access Pulse and this feature, along with their department name and email ID.
¶ 5. Calculations
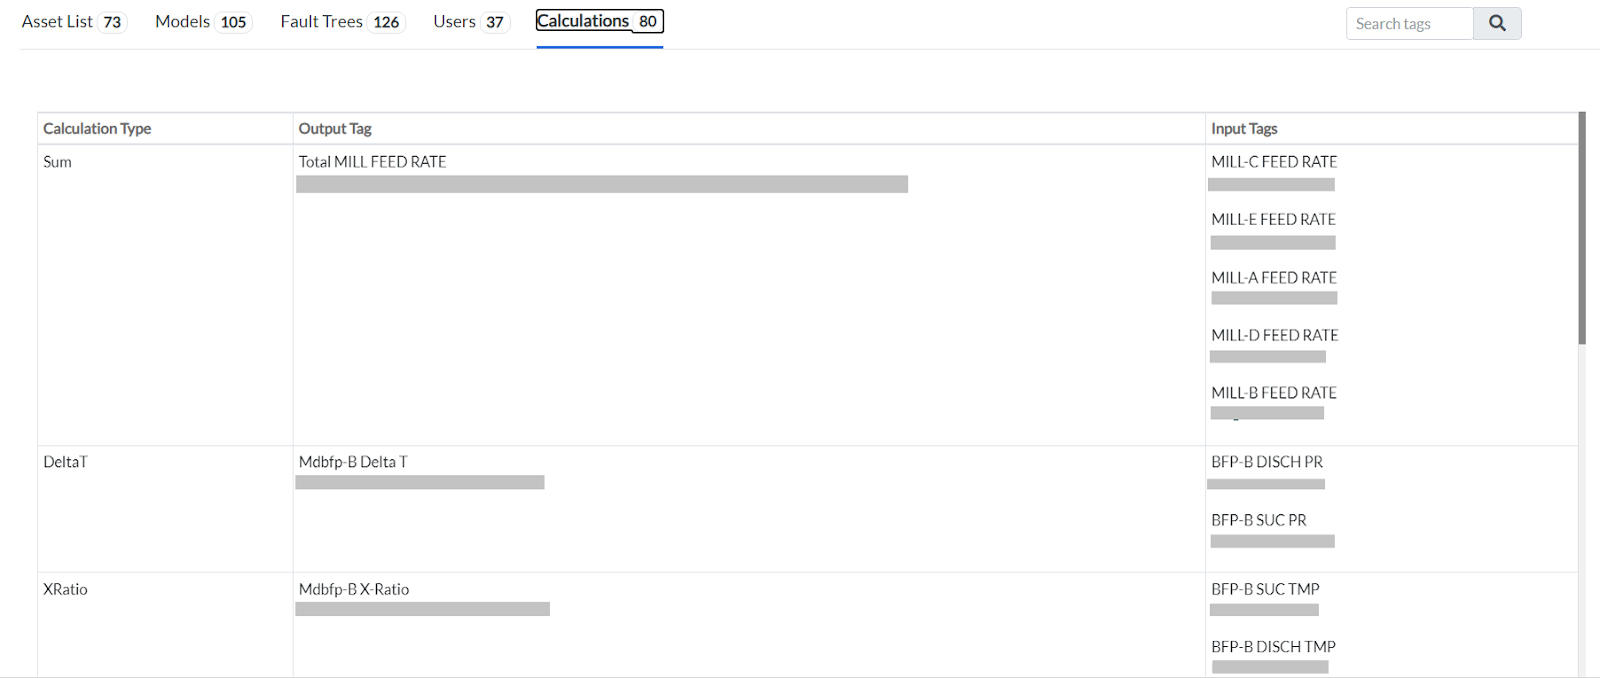
Figure 23. Calculations in Configure Asset
Clicking the "Calculations" option provides users with details of all the calculations applied to the input tags to generate the desired output tag. For example, in the image above, the "SUM" function is applied to a list of input tags to derive the Total Mill Feed Rate.
There is a scroll option to scroll the list of tags and a Search button to search the tag directly.