¶ Asset Manager
The Asset manager module optimizes asset management by integrating processes and failure history. It enhances efficiency, conserves resources, and boosts boiler output significantly.
Asset Manager page appears as shown below -
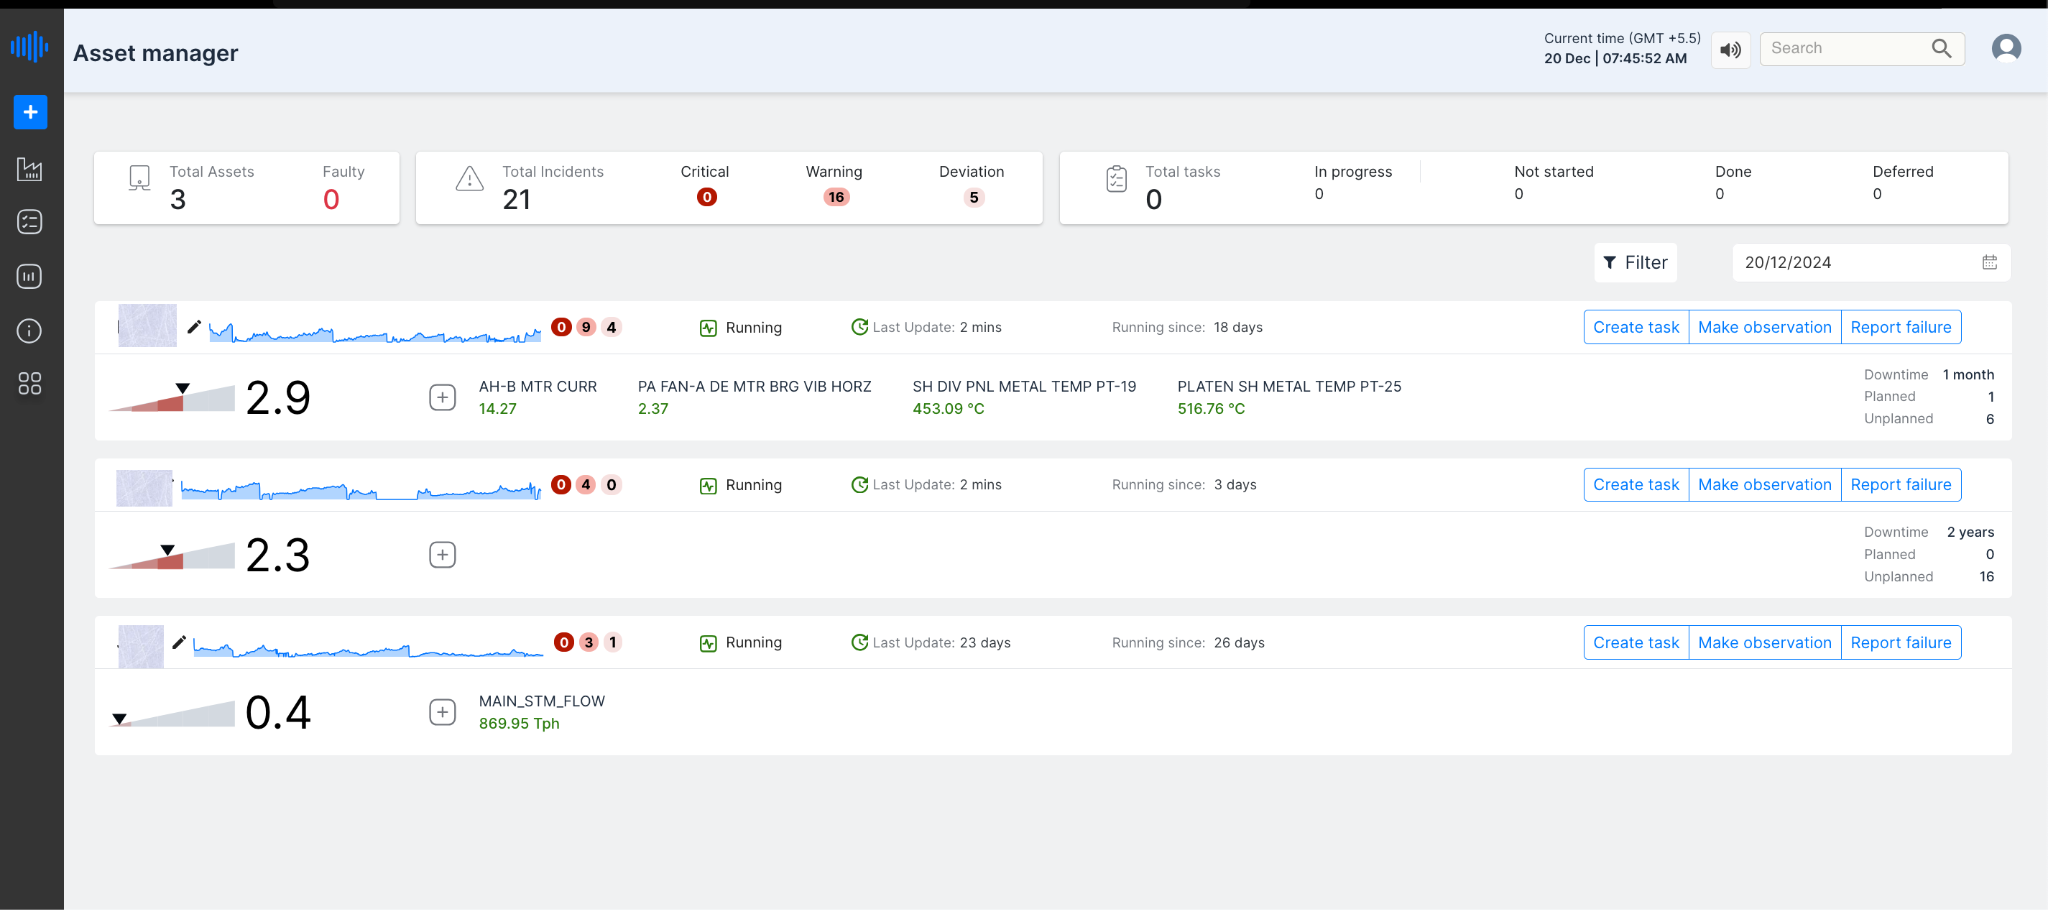
Figure 1: Asset Manager page
The add button helps the user to add an asset, task, or Failure report to the asset manager UI enhancing user control and management capabilities.
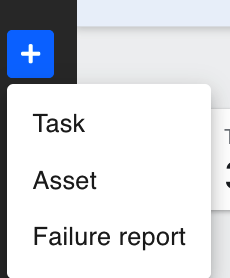
Figure 2: Add Asset
Adding an Asset in Asset Manager
To add an asset in the Asset Manager, follow these steps:
-
Click on the "Asset" option in the user interface.
-
You will be directed to a screen where you can input the required details of the asset.
-
Enter all necessary information, such as Source, Unit, Equipment Category, Name-plate details, Type of lab reports available, Blacklist tags, Version, and any other relevant data. [Refer to the figure below]
-
After entering the details, click on the "Save" button to confirm and add the new asset to the Asset Manager.
-
The system will validate the information and notify you upon the successful addition of the asset.
By following these steps, you can effectively add and manage assets within the Asset Manager application.
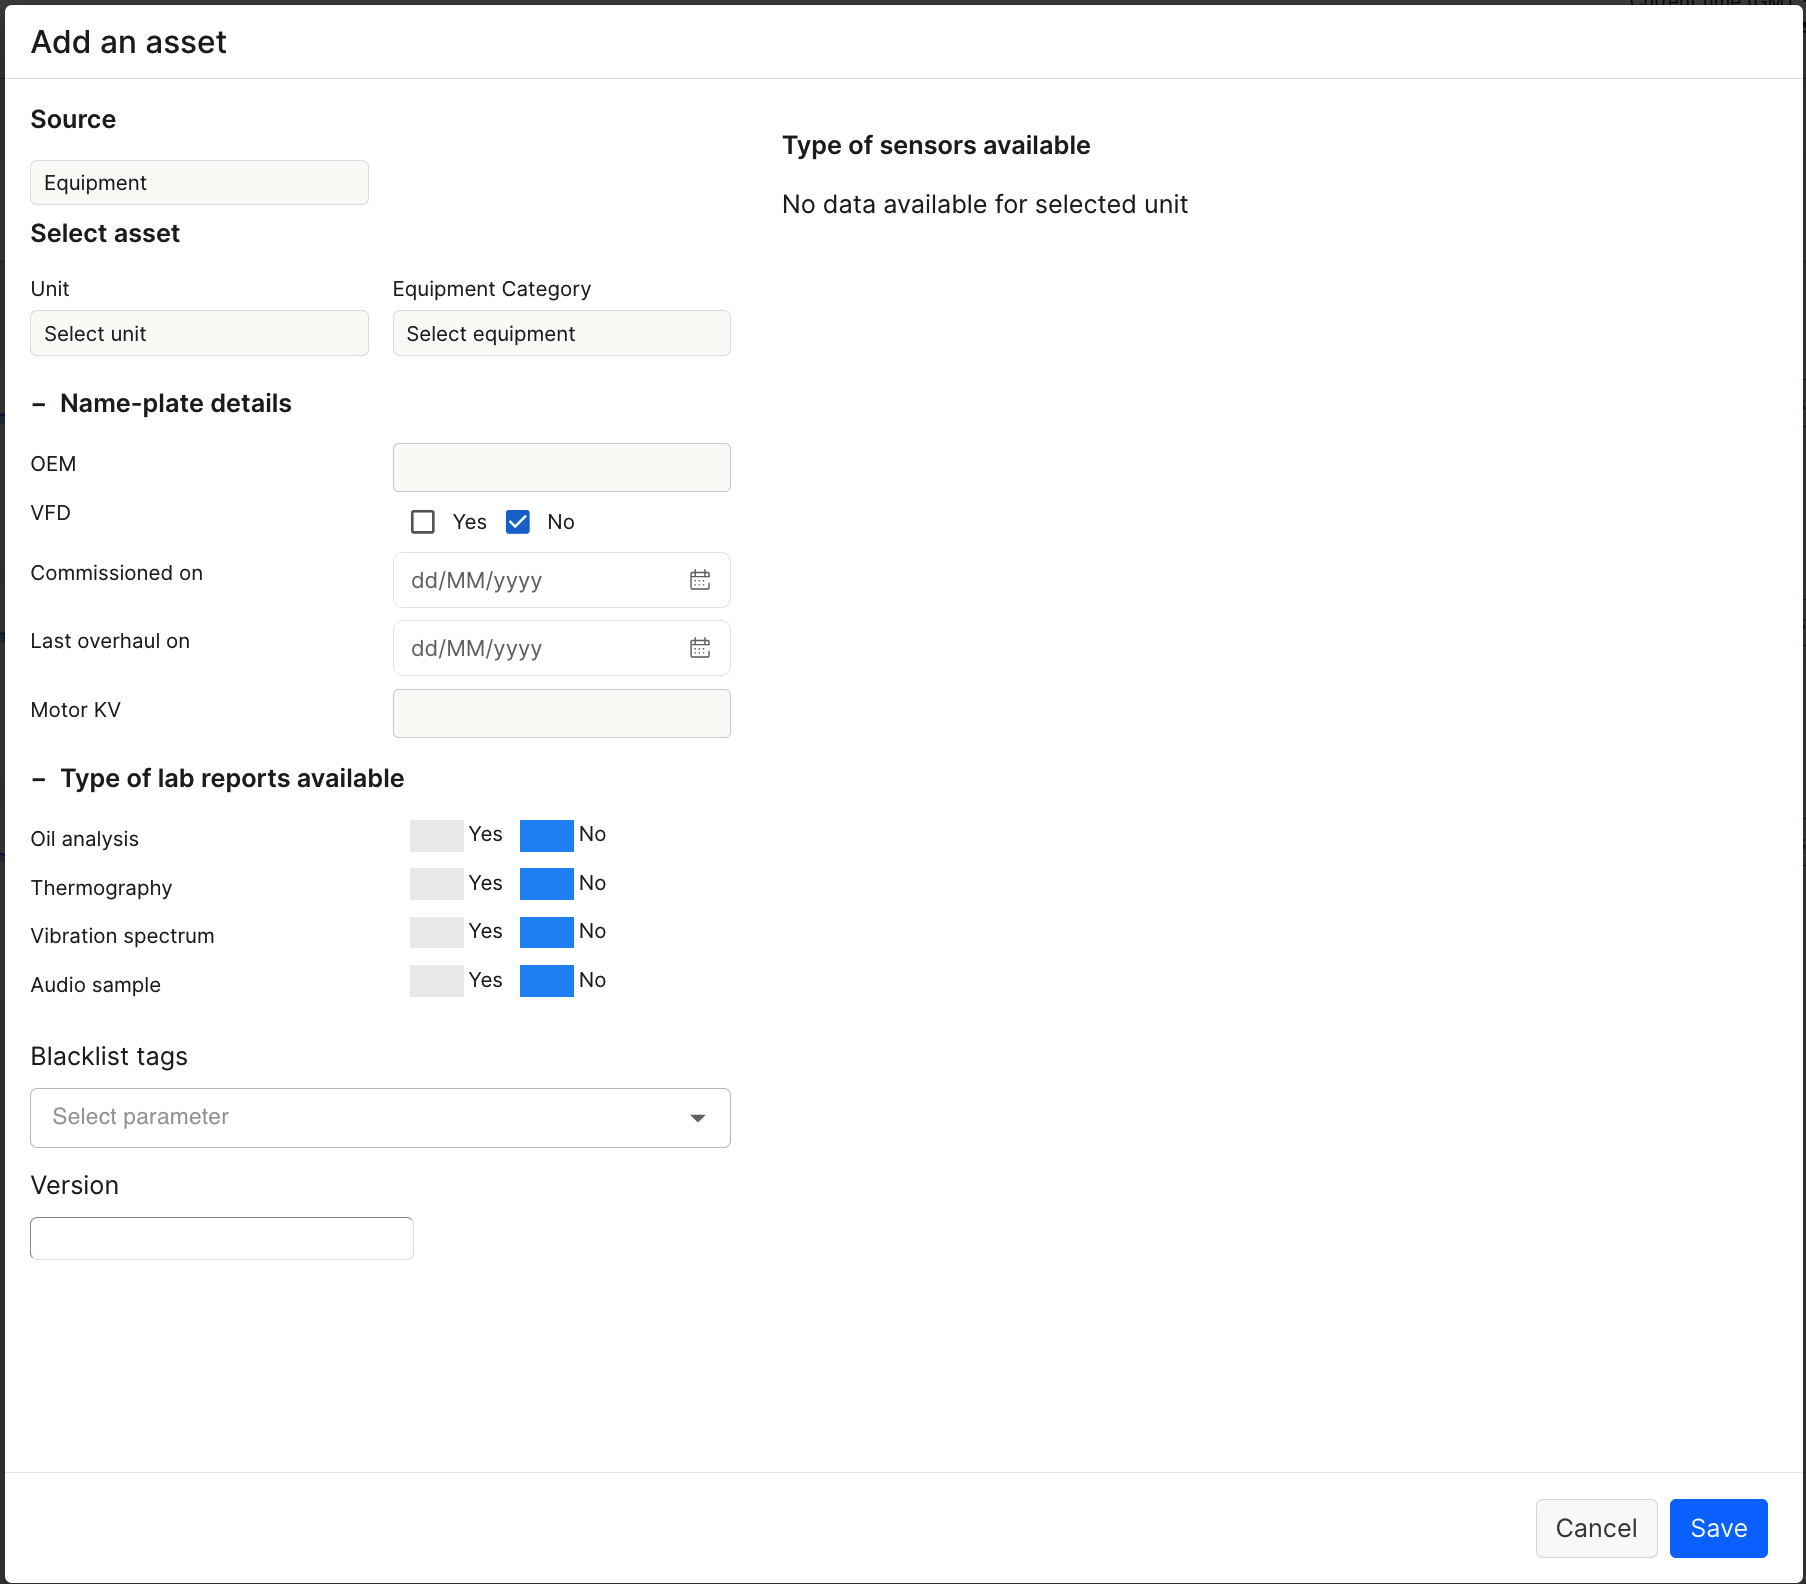
Figure 3: Add an asset window
At the top, users can access dashboards for Assets, incidents, and tasks related to Asset management. Here's an explanation about each of them,
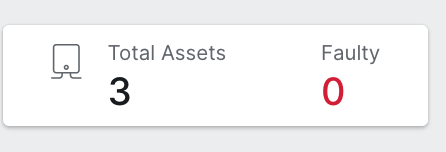
Figure 4: Total assets and faulty assets
The above figure shows the information about the total number of assets(boilers) configured and the number of them that are faulty or not functioning.
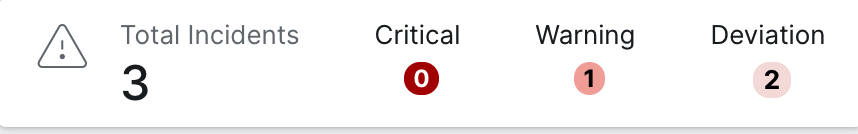
Figure 5: Total number of incidents
The above figure shows the number of active incidents and the status of them pertaining,
Total Incidents: This represents the overall count of incidents. According to the image, there are 3 incidents in total.
Critical: This indicates the number of critical incidents. The image shows that none of the 3 incidents are marked as critical.
Warning: This denotes the number of warnings. From the image, it is evident that out of the 3 incidents, one is marked as a warning.
Deviation: This refers to the number of deviations. The image indicates that out of 3 incidents, 2 are marked as deviations.
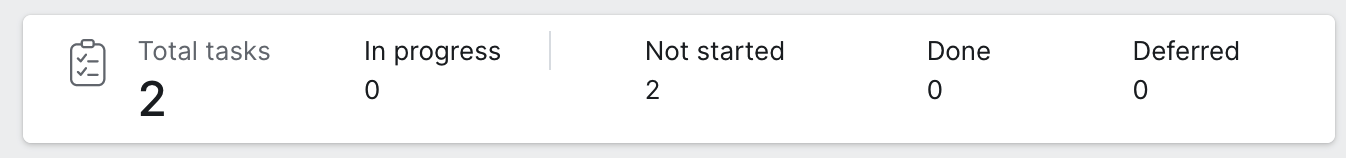
Figure 6: Total number of tasks
¶ Task Status Overview
The above figure illustrates the number of tasks and their respective statuses. The categories are defined as follows:
-
Total Tasks: This represents the total number of tasks created in the context of the boilers, which is 2 in this instance.
-
In Progress: This indicates the number of tasks currently being worked on, which is 0 in this case.
-
Not Started: This shows the number of tasks that have not yet been initiated, totaling 2 in this scenario.
-
Done: This denotes the number of tasks that have been completed, with a count of 0 here.
-
Deferred: This indicates the number of tasks that have been postponed or deferred, which is 0 in this example. If a task is created but deemed irrelevant, the user may decide to defer it and not take up the task.
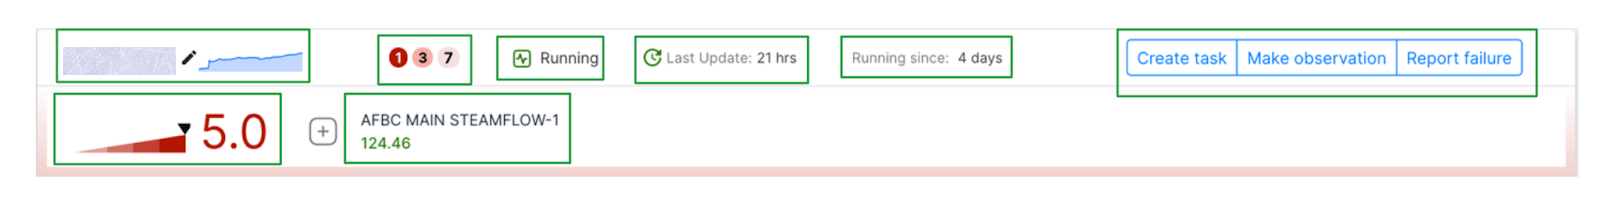
Figure 7: Asset List
This component on the screen shows the status of the asset and other information.
-
Asset name - This shows the name of the Asset
-
 This shows the number of incidents categorized as follows: "1" for critical, "3" for warning, and "7" for deviation.
 -
Running -The status of the asset is displayed as "Running" if it is online; otherwise, the status is shown as "Offline"
-
Last update: 21 hrs - shows the last update of the boiler
-
Running since: 4 days - shows the current status of how long the asset has been in operation since the last shutdown.
-
 shows the "risk score" for the boiler.
 -
 shows the latest value(based on the last update) of the tags configured for the boiler.
This helps the user to have deeper insight into the working of the boiler and also provides insights into mitigation methods to avoid downtime or insufficiencies in the future.
When the user clicks on the boiler six additional tabs are shown -
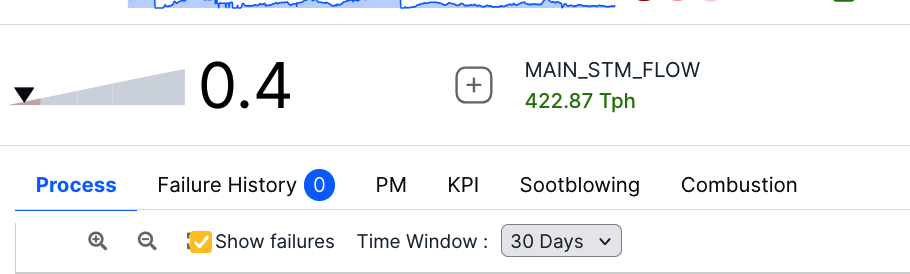
Figure 8: Tabs on clicking the asset
1. Process
2. Failure history
3. PM
4. KPI
5. Sootblowing
6. Combustion
Here is the functioning of these two tabs individually.
Process
The Process window deals with the risk scores generated by the Pulse UI.
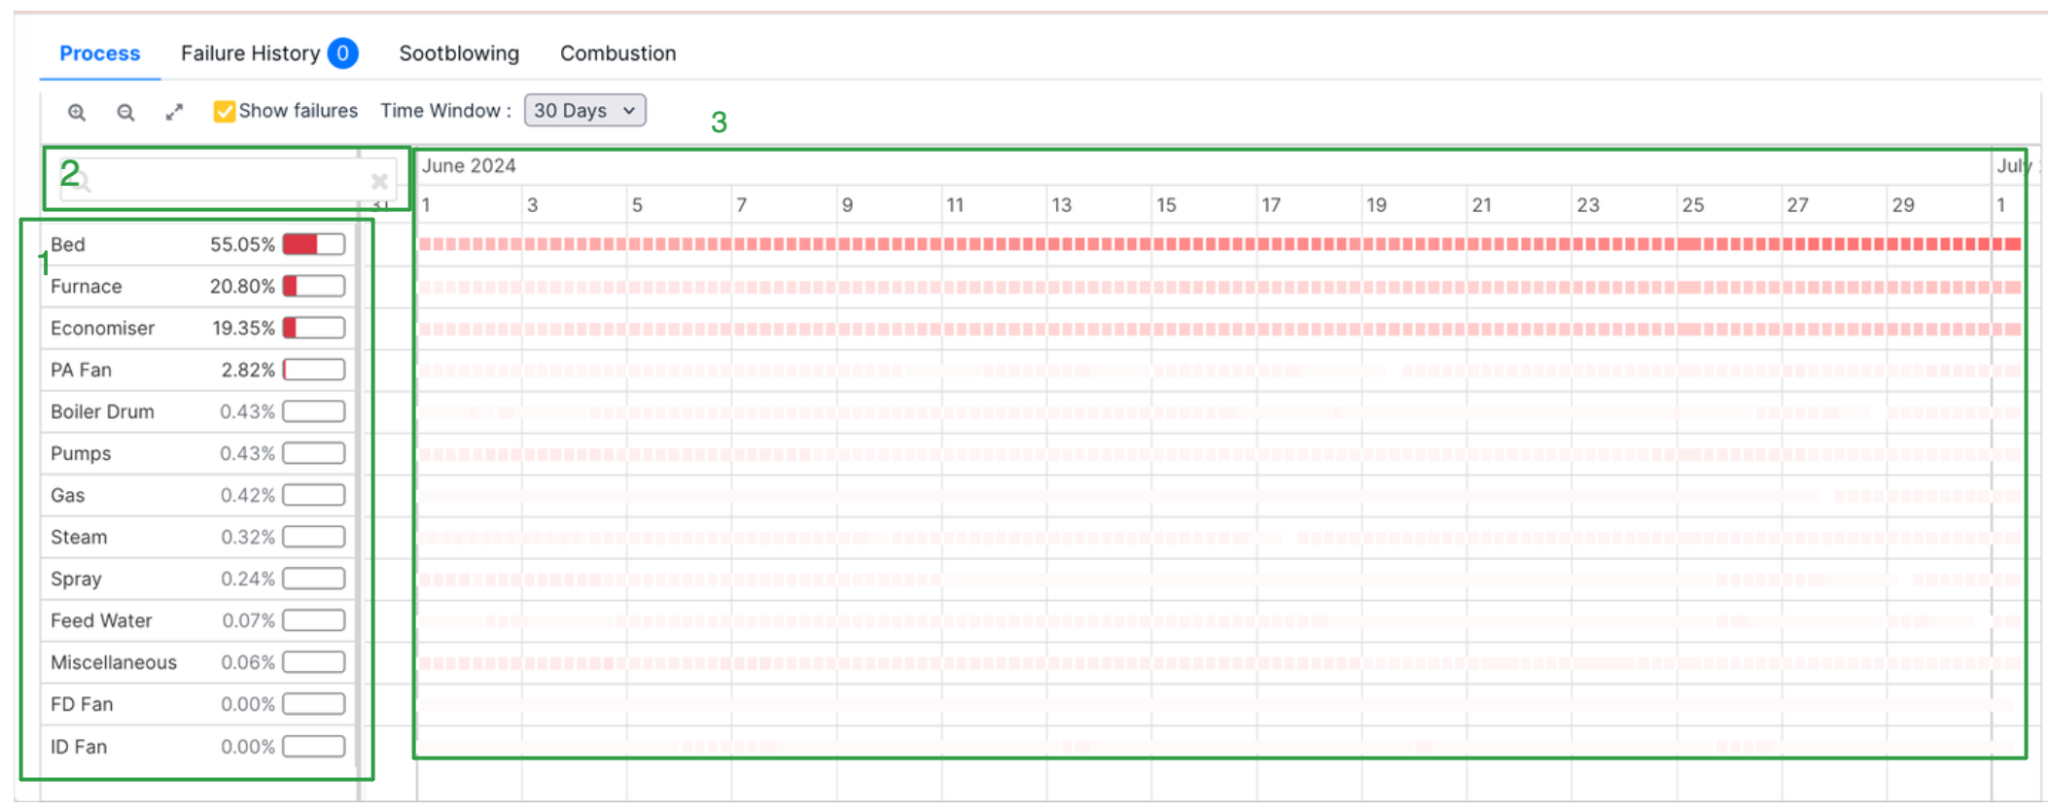
Figure 9: Process Tab
-
On the left-hand side, the user has different factors with their contribution to the risk score. The risk score is calculated based on the contribution of all these factors in the percentages shown with them. The risk score is calculated every 6 hours using these different factors and updated on the dashboard.
-
The user can use the search bar to check the contribution of a specific factor to the risk score.
-
The timeline ahead gives a history of the values of risk scores across time. Hovering over the red indicators shows the value of the risk score at that time.
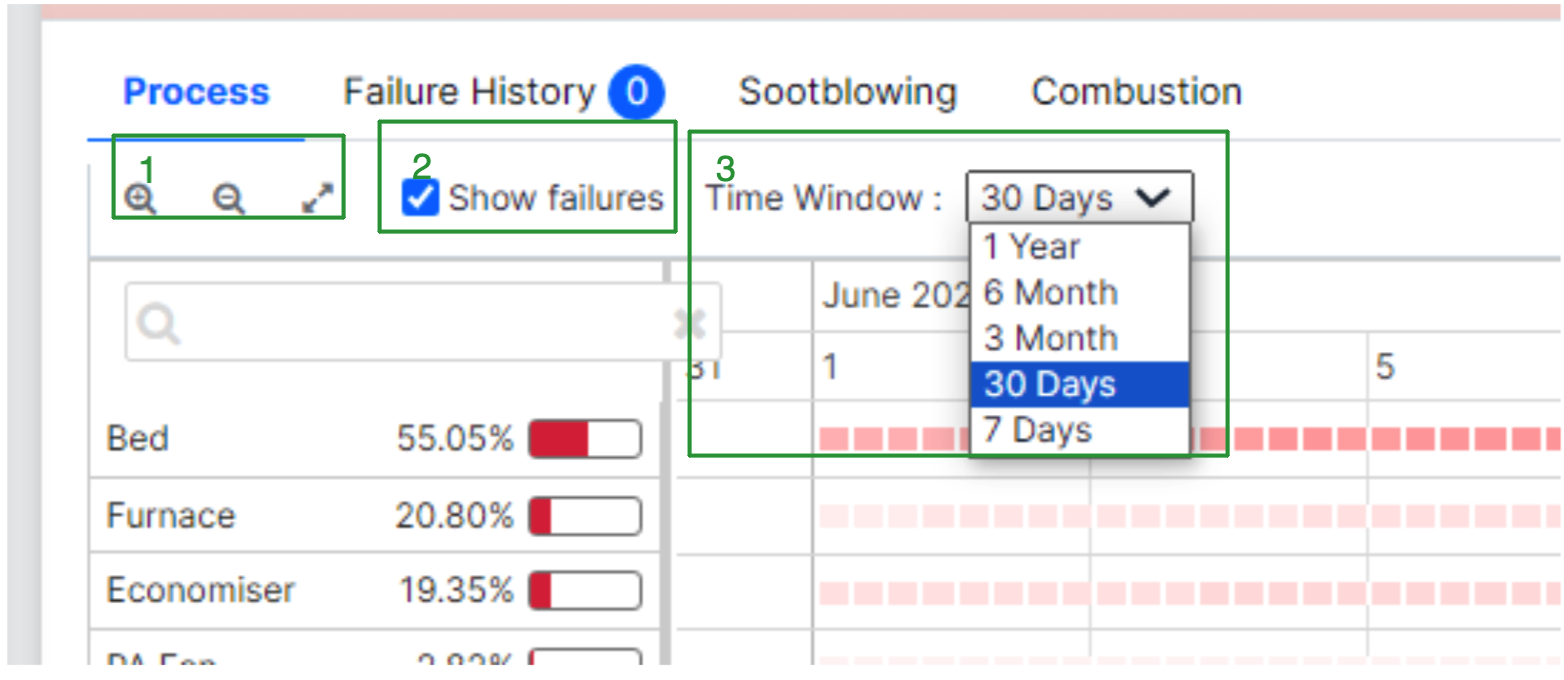
Figure 10: Options in the process tab
-
The user can make use of the zoom-in, zoom-out, and maximize tools.
-
The user can see a history of failures in the timeline itself if they check the "show failures" box.
-
The user can also choose the time window by using the dropdown.
Clicking on an instance of a parameter opens up more details for the parameter.
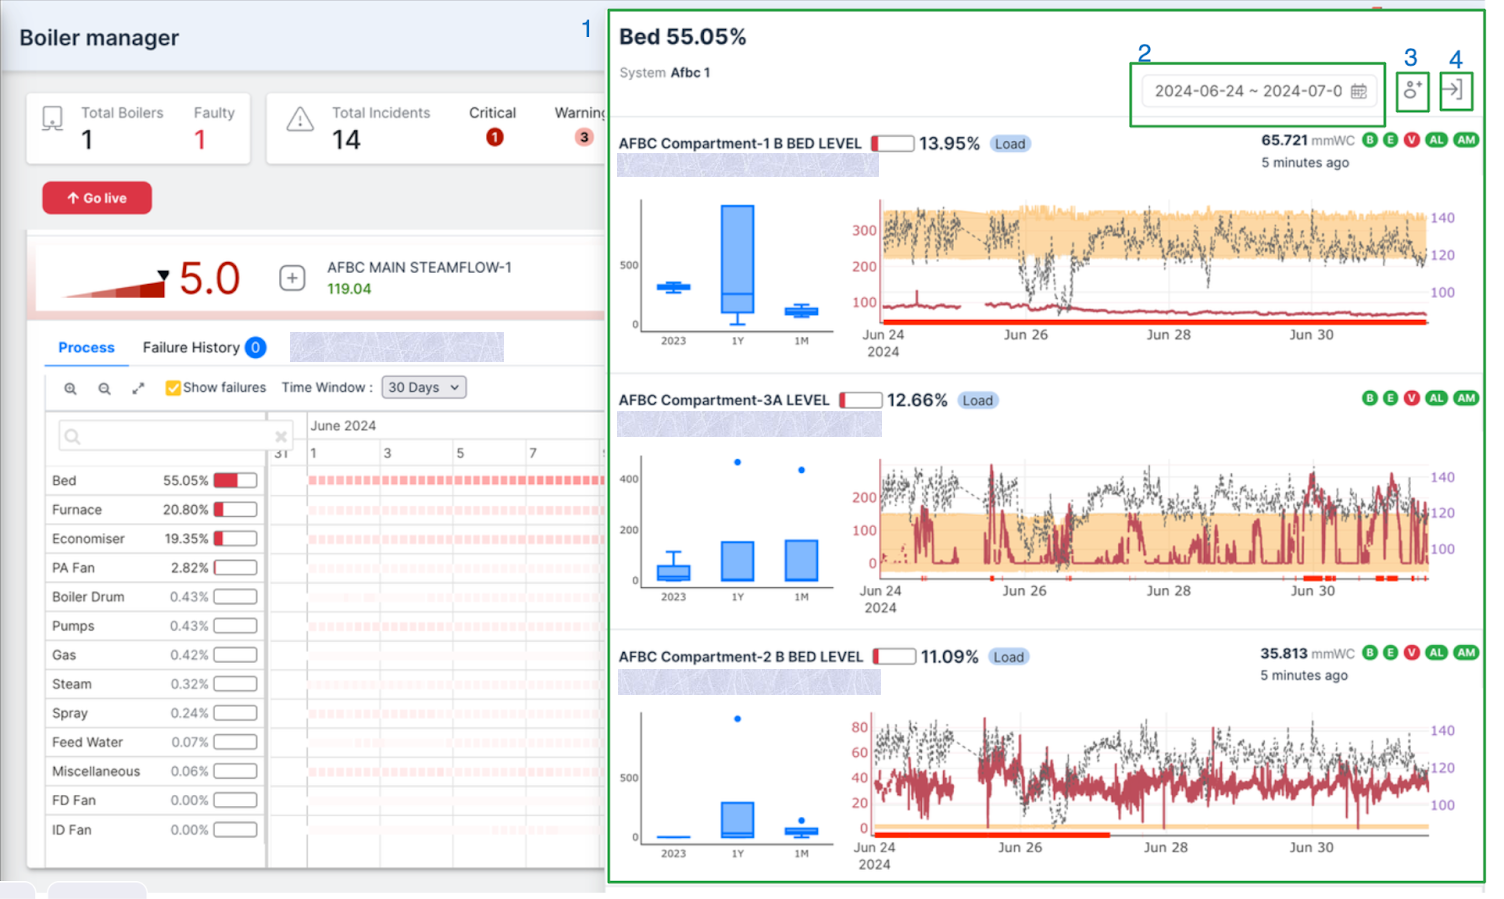
Figure 11: Parameter info tab
-
In this image, the user can see that a new drawer opens up within the Pulse UI where they can have more details about the parameter. With the live value of the tags affecting the parameter.
-
This image shows the date selector and two more buttons, the date selector is to change the time the user is looking at. -
Then there is the "Create Task" button
-
The "Close drawer" button.
Failure History
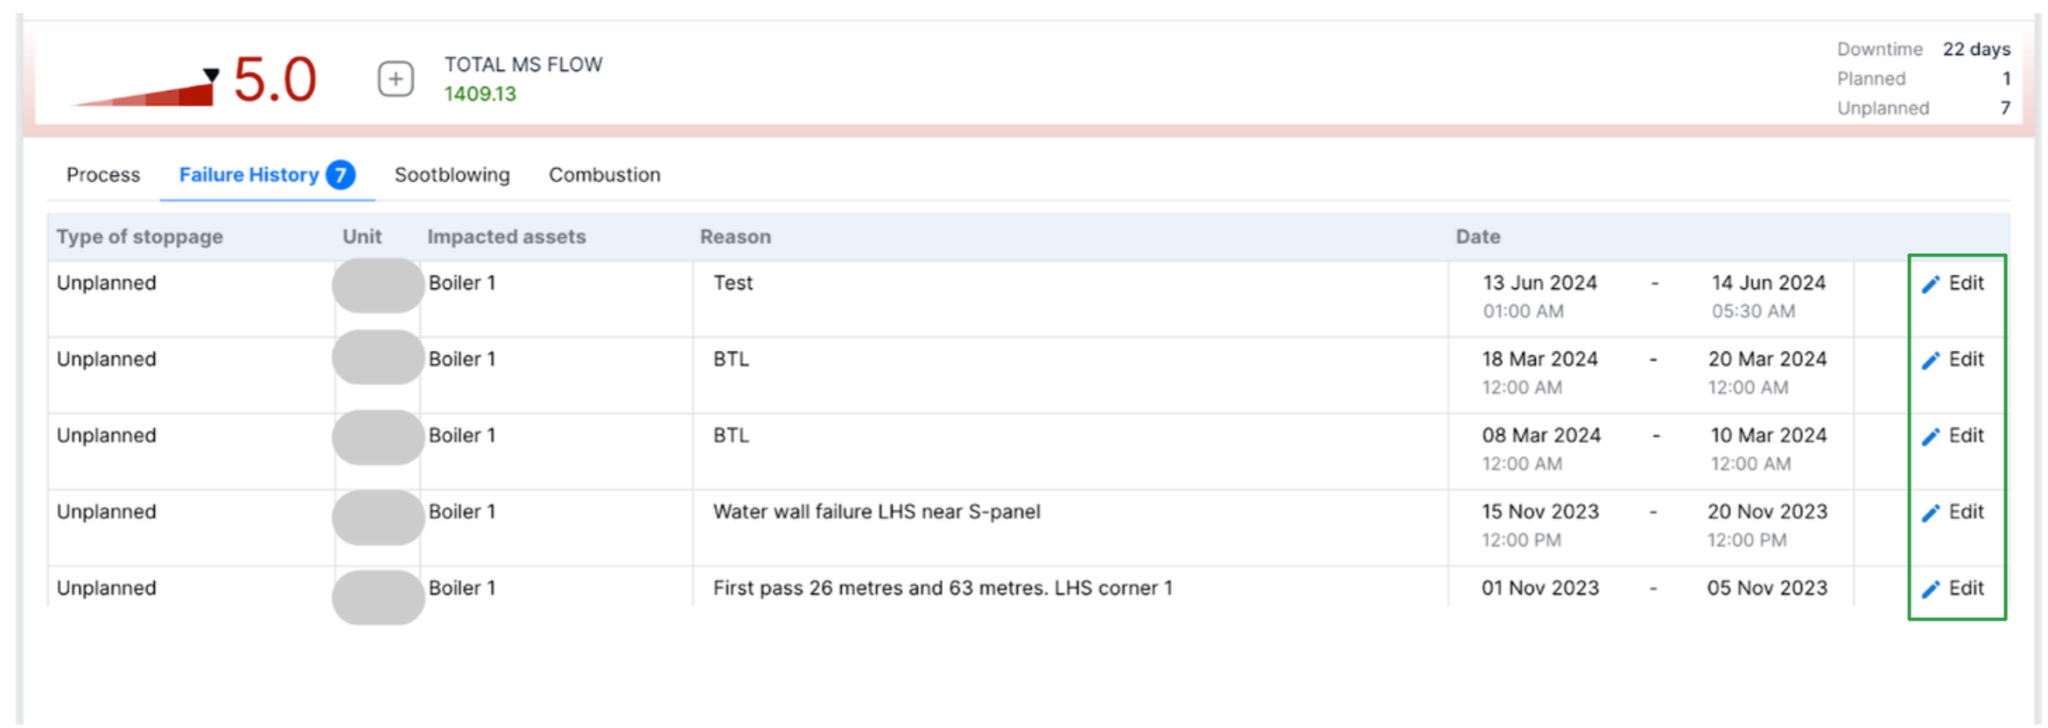
Figure 12: Failure History tab
It is crucial for the smooth operation of an asset that the user continuously monitors if it's functioning or not and a precise ledger of the events is created when it isn't functional. So that the user can have a plan for the future to counter the shortcomings and save our resources.
That is exactly what failure history aims to do. This tab offers a list of all the failures that occur with the asset(boiler) which results in downtime. The failure history is configured to provide the user with insights out of failure which are different sections of the table.
The user can see the Type of stoppage, Unit, Impacted assets, Reason for failure, and the date and time for the period of downtime.
There's also an edit button(highlighted in green) on the right which helps the user to edit the failure according to the circumstances as they pose themselves.
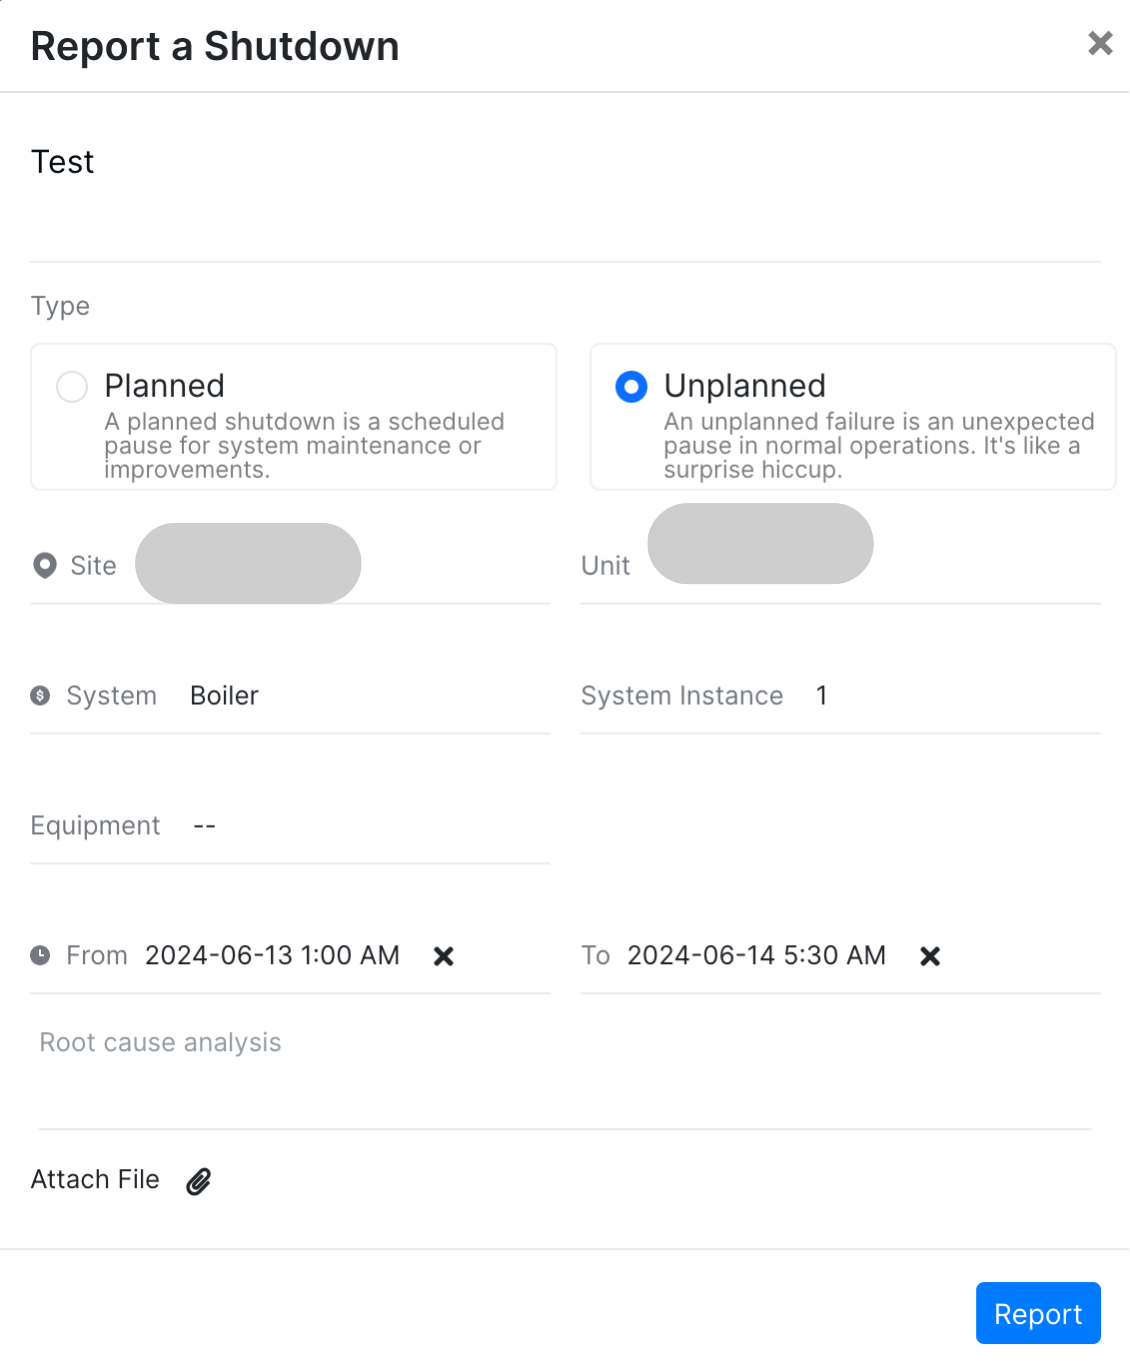
Figure 13: Report a failure/shutdown dialog
The edit window enables the user to modify the report and includes additional sections such as site, unit, system, system instance, equipment, date, root cause analysis, and an attachment option. These sections help the user provide more context to the failure for better analysis.
PM
Click the PM tab to view the past and the upcoming PM activities and allows you to Add a PM activity, edit or delete an upcoming one, or disable it if you feel the activity is not required to be initiated.
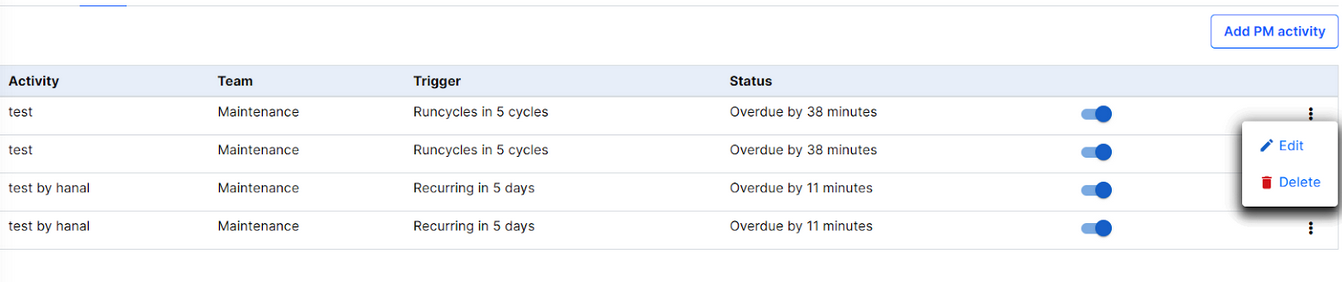
Figure 14: Preventive Maintenance Record
¶ Adding New PM Activity
The output of a PM is the creation of a task and notifying the same to the team. To do this,
- Click Add PM activity. The Create PM Activity popup displays with the Equipment Name.
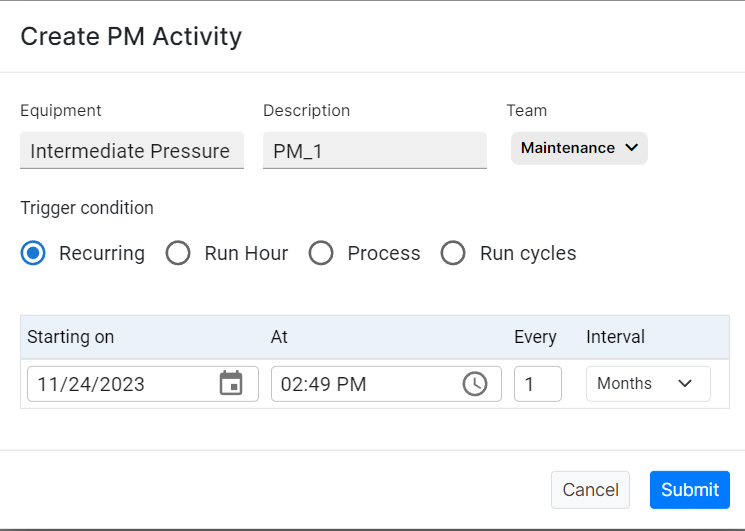
Figure 15: Create PM Activity for any asset
-
Enter a brief description of the activity.
-
Select the Team from the drop-down list.
-
Select the Trigger Condition. The options are:
a. Recurring - Select the Start Date and Time, enter the recurrence number, and select the interval - Hours, Days, Weeks, and Months.
b. Run Hour - Select the Start Date and Time, and enter the Run-Hour number.
c. Process - Select the Parameter and Condition from the drop-down lists, the Threshold number (upon reaching which the process will be triggered), enter the recurrence number and select the interval - Hours, Days, Weeks, and Months.
d. Run Cycles - Select the Start Date and Time, and enter the Run-Cycle number.
-
Click Submit. Based on the Trigger Conditions you have selected, the selected Team will be notified of a Task and displayed under Upcoming Tasks for the team.
KPI
When dealing with different assets it is an ample requirement to keep a close eye on the incidents that arise concerning the assets. To mitigate the risks and properly handle them.
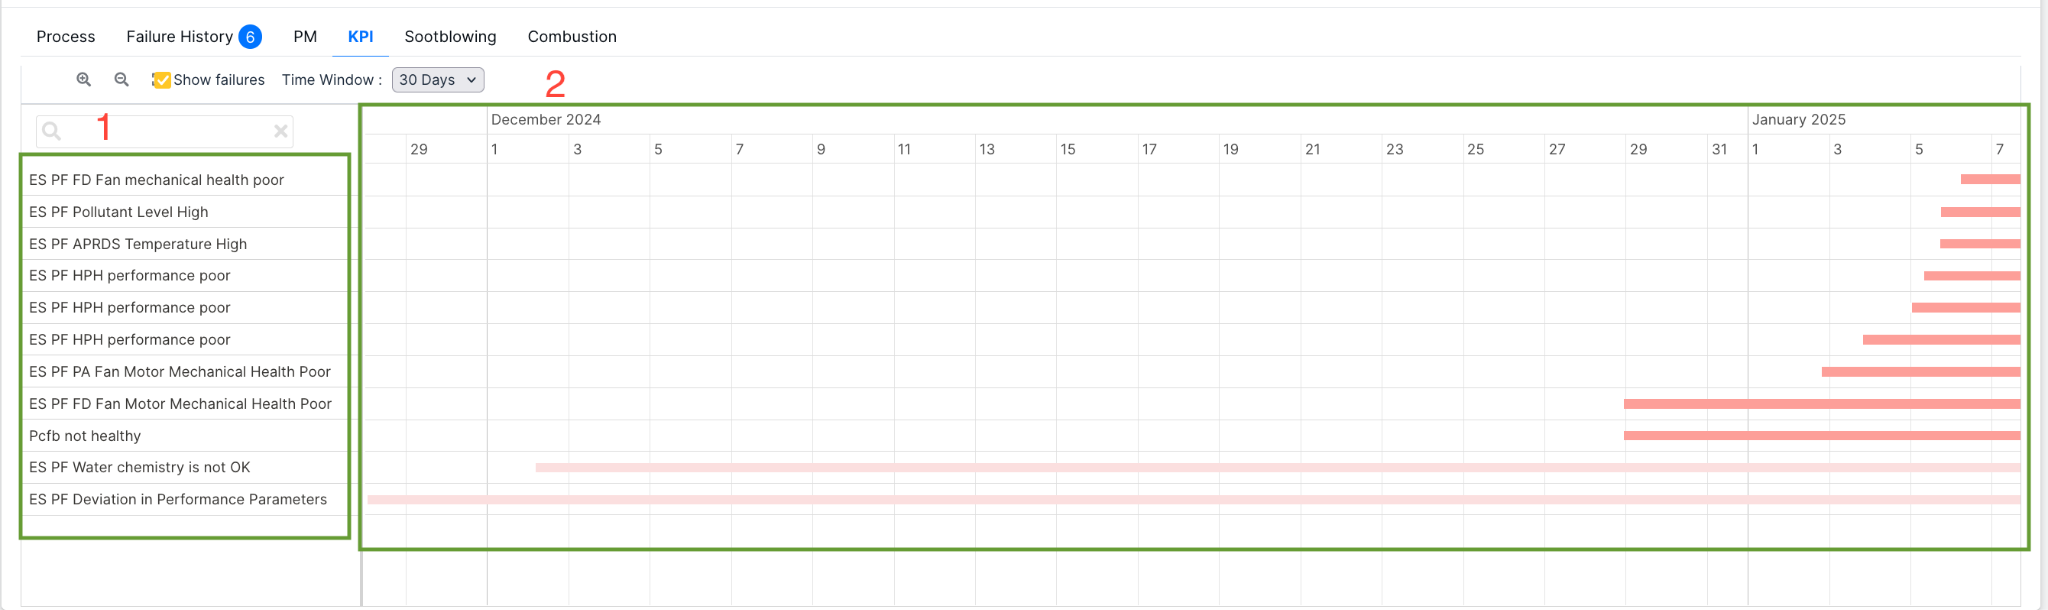
Figure 16: KPI tab
The KPI tab helps with showing the incidents. The different parts include the following.
-
On the left-hand side, we have the list of the different incidents.
-
On the right-hand side, we have the calendar view of the incidents, where the color of the bar indicates the severity of the incident the length of the bar on the calendar indicates the period for which it was observed.
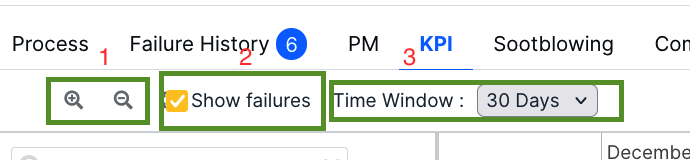
Figure 17: Options in the process tab
1. The user can make use of the zoom-in, zoom-out, and maximize tools.
2. The user can see a history of failures in the calendar view itself if they check the "show failures" box.
3. The user can also choose the time window by using the dropdown.
Clicking on an instance of an incident opens up more details about the incident.
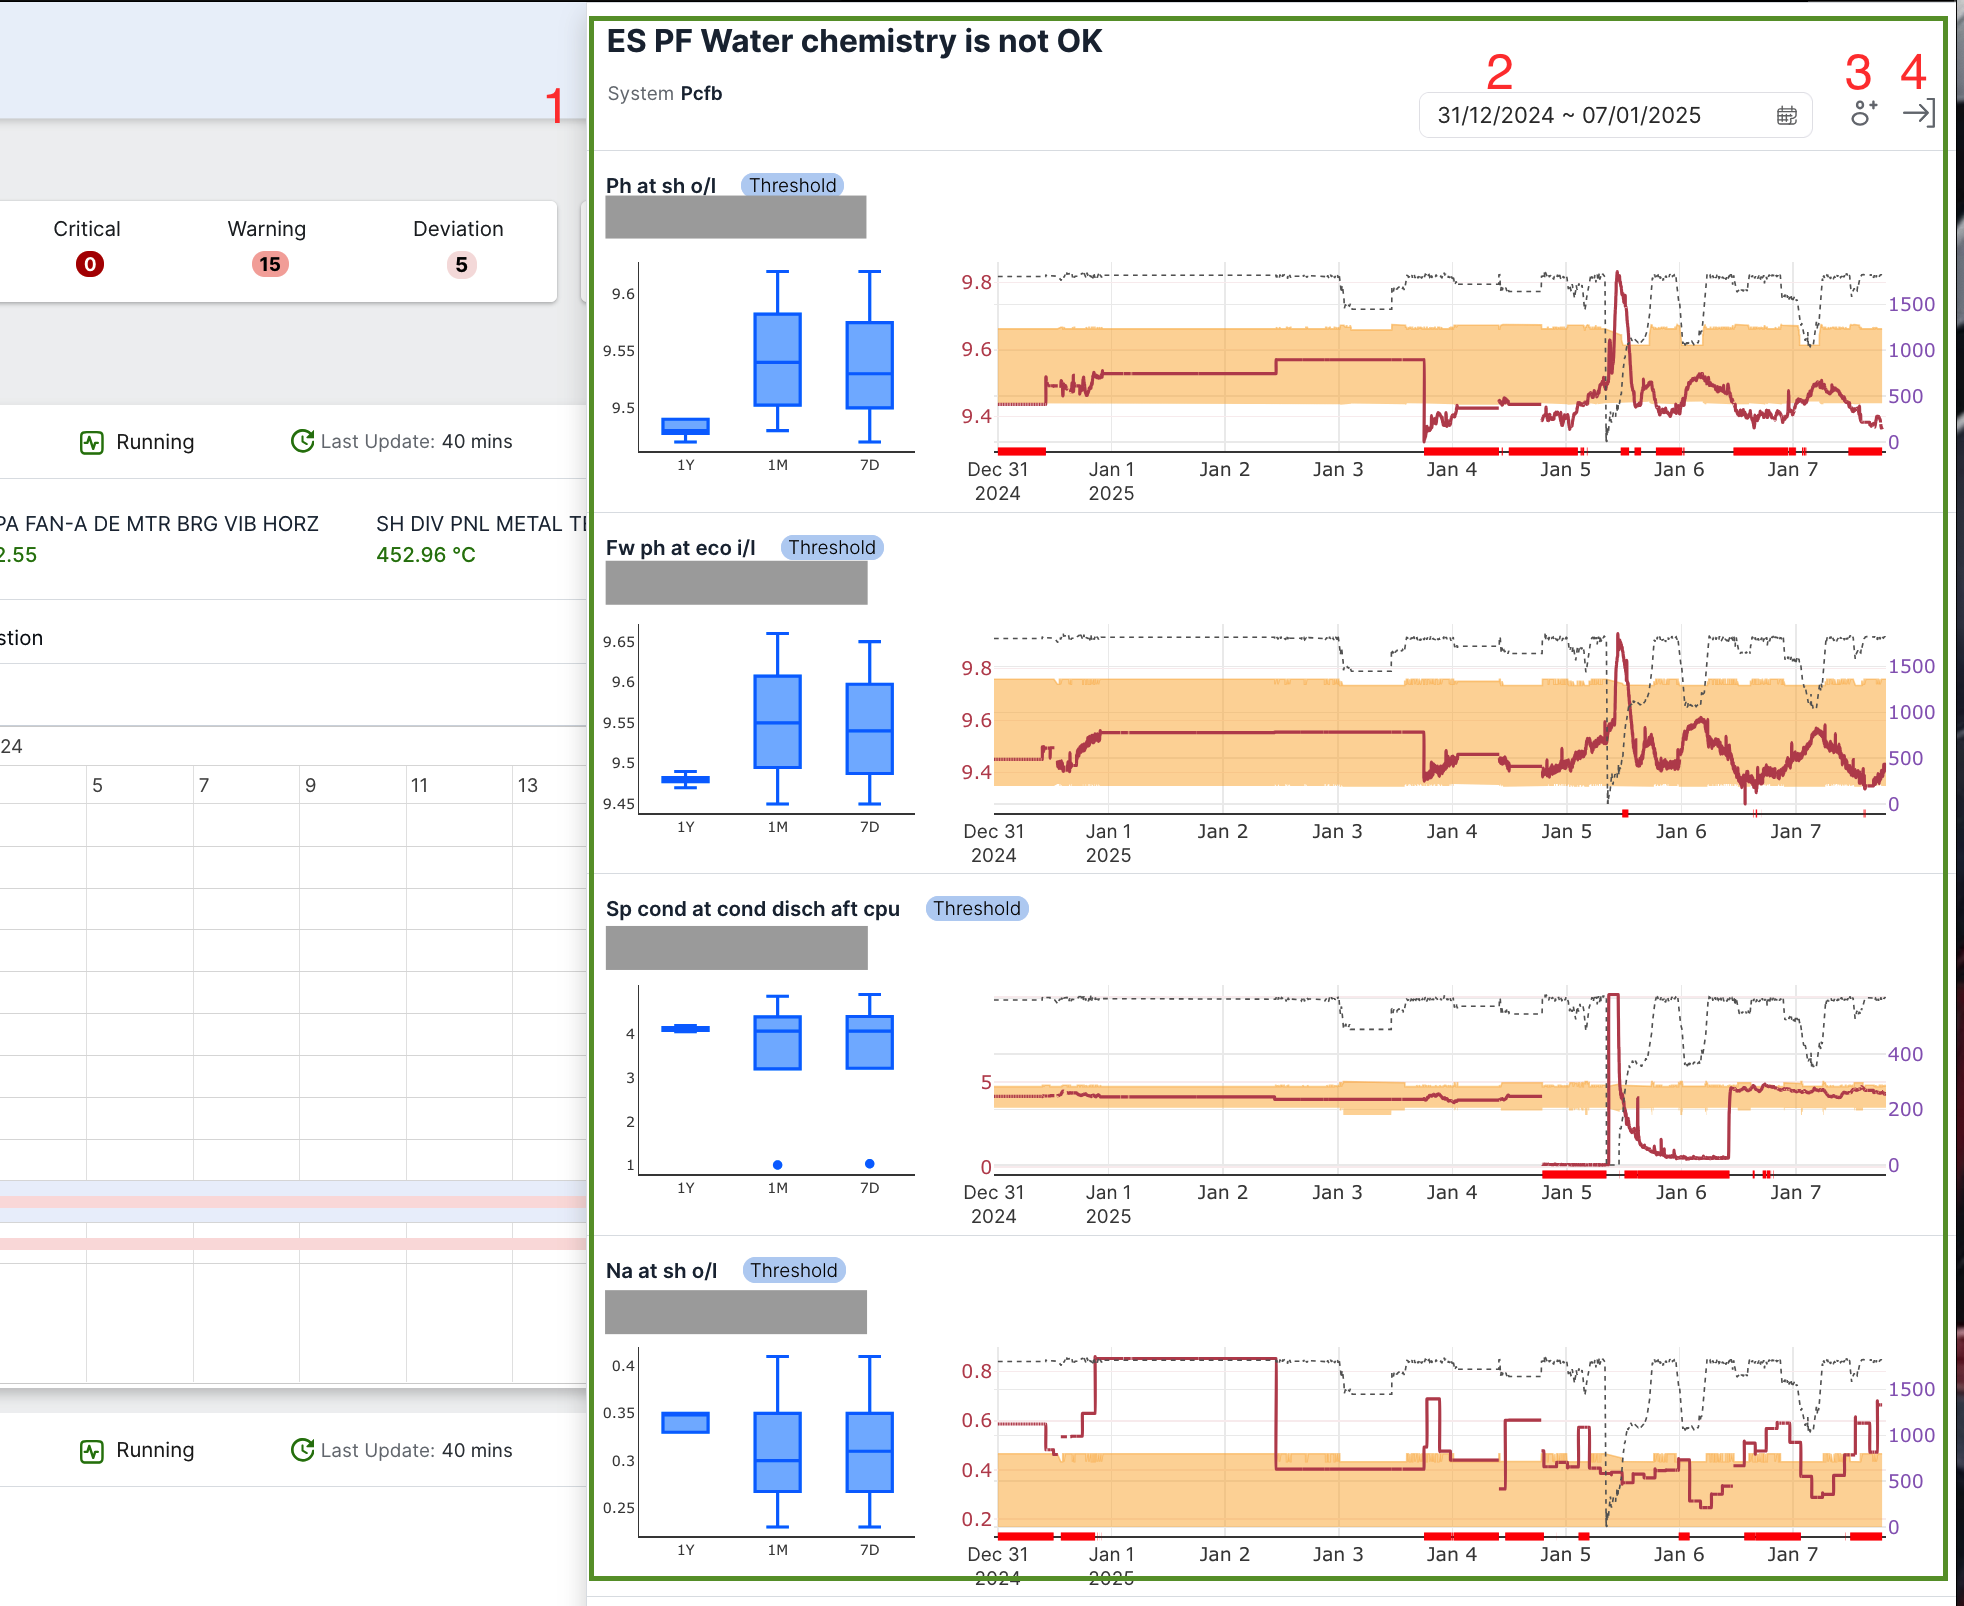
Figure 18: Incident info tab
-
In this image, the user can see that a new drawer opens up within the Pulse UI where they can have more details about the incident.
-
This image shows the date selector and two more buttons, the date selector is to change the time the user is looking at.
-
Then there is the "Create Task" button
-
The "Close drawer" button.
Sootblowing
The Sootblowing tab manages operations related to the boiler's soot-blowing activities. Tasks are generated in this tab whenever the soot-blowing module detects inconsistencies or issues with the boiler. These tasks are then utilized for detailed analysis and effective error management processes.
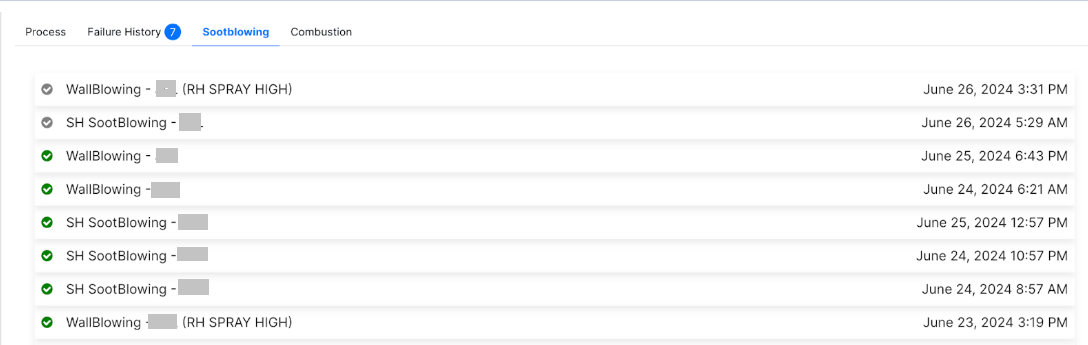
Figure 19: Soot-blowing tab
When the user clicks on a task mentioned in this tab, they are redirected to the tasks page, where they can assign someone to look into the issue of what triggered the series of events that led to the warning from the Sootblowing module.
Combustion
When dealing with boilers, the user requires the best power consumption profile for the boiler. If the power usage of the boiler isn't monitored continuously, valuable resources get wasted.
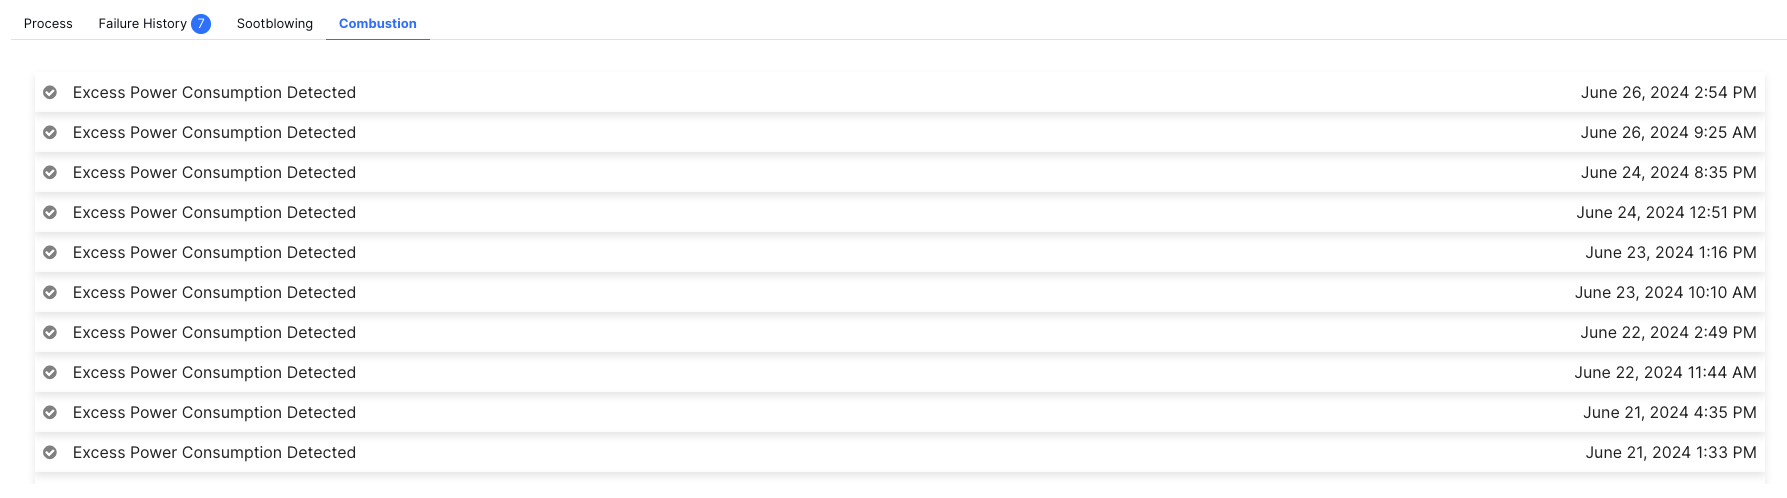
Figure 20: Combustion tab
The Combustion tab addresses the issue of excess power consumption for the user. It automatically records every instance of excess power consumption and categorizes it as a task on the tasks page. This meticulous monitoring capability enables users to closely observe the boiler's behavior.
When a user clicks on a task, they are redirected to the tasks page, where they can assign someone to investigate the cause of the events that led to the excess power consumption.