¶ Introduction
RUL stands for Remaining Useful Life. The RUL Module is a feature within the Asset Performance Management platform that analyses temperature and vibration sensor data from rotary equipment to determine how long that equipment can continue operating before a defined critical limit is reached. The module is accessible through the Asset Management section of the platform, by navigating to Equipment, grouping by unit, and selecting the RUL tab for the relevant asset. By implementing this diagnostic script, the reliability team can effectively manage the P-F Interval (the time between potential failure detection and functional failure), allowing for scheduled interventions during planned outages rather than suffering forced load reductions or catastrophic equipment damage.
This document provides a complete technical description of the module, covering its scope, data processing approach, forecasting methodology, output interpretation, and known limitations. All content is based strictly on the implementation discussion and the application screenshots provided.
¶ Scope
The RUL Module is applicable exclusively to rotating equipment assets, such as Induced Draft (ID) fans, Forced Draft (FD) fans, and Boiler Feed Pumps (BFPs), among other similar equipment types. The module processes two categories of sensor tags:
- Temperature tags, which capture bearing and equipment surface temperatures.
- Vibration tags, which capture mechanical vibration levels at defined measurement points.
The module does not currently process other parameter types such as pressure, flow rate, or power consumption. Critical operational limits used within the module are asset- and tag-specific values defined and provided by the client during the onboarding process.
Note: The RUL Module is designed specifically for rotary equipment. Deployment on non-rotary assets or non-temperature/vibration parameter types is outside the current functional scope of the module.
¶ Module Overview
The RUL Module monitors the health of rotating equipment by continuously analysing recent historical trends in temperature and vibration sensor data. For each configured tag, the module ingests the preceding 30 days of hourly averaged readings, trains a time-series forecasting model on this data window, and projects the sensor value trajectory over the next 15 days. The primary objective is to determine whether, and when, the forecasted value is expected to cross a predefined critical threshold.
The output of this analysis is expressed as the Remaining Useful Life — a measure, in hours, of the time available before the monitored parameter reaches its critical operating limit. This information is presented directly within the platform's RUL tab for each configured asset, enabling operations and maintenance teams to take targeted, pre-emptive action before equipment degradation reaches a critical state.
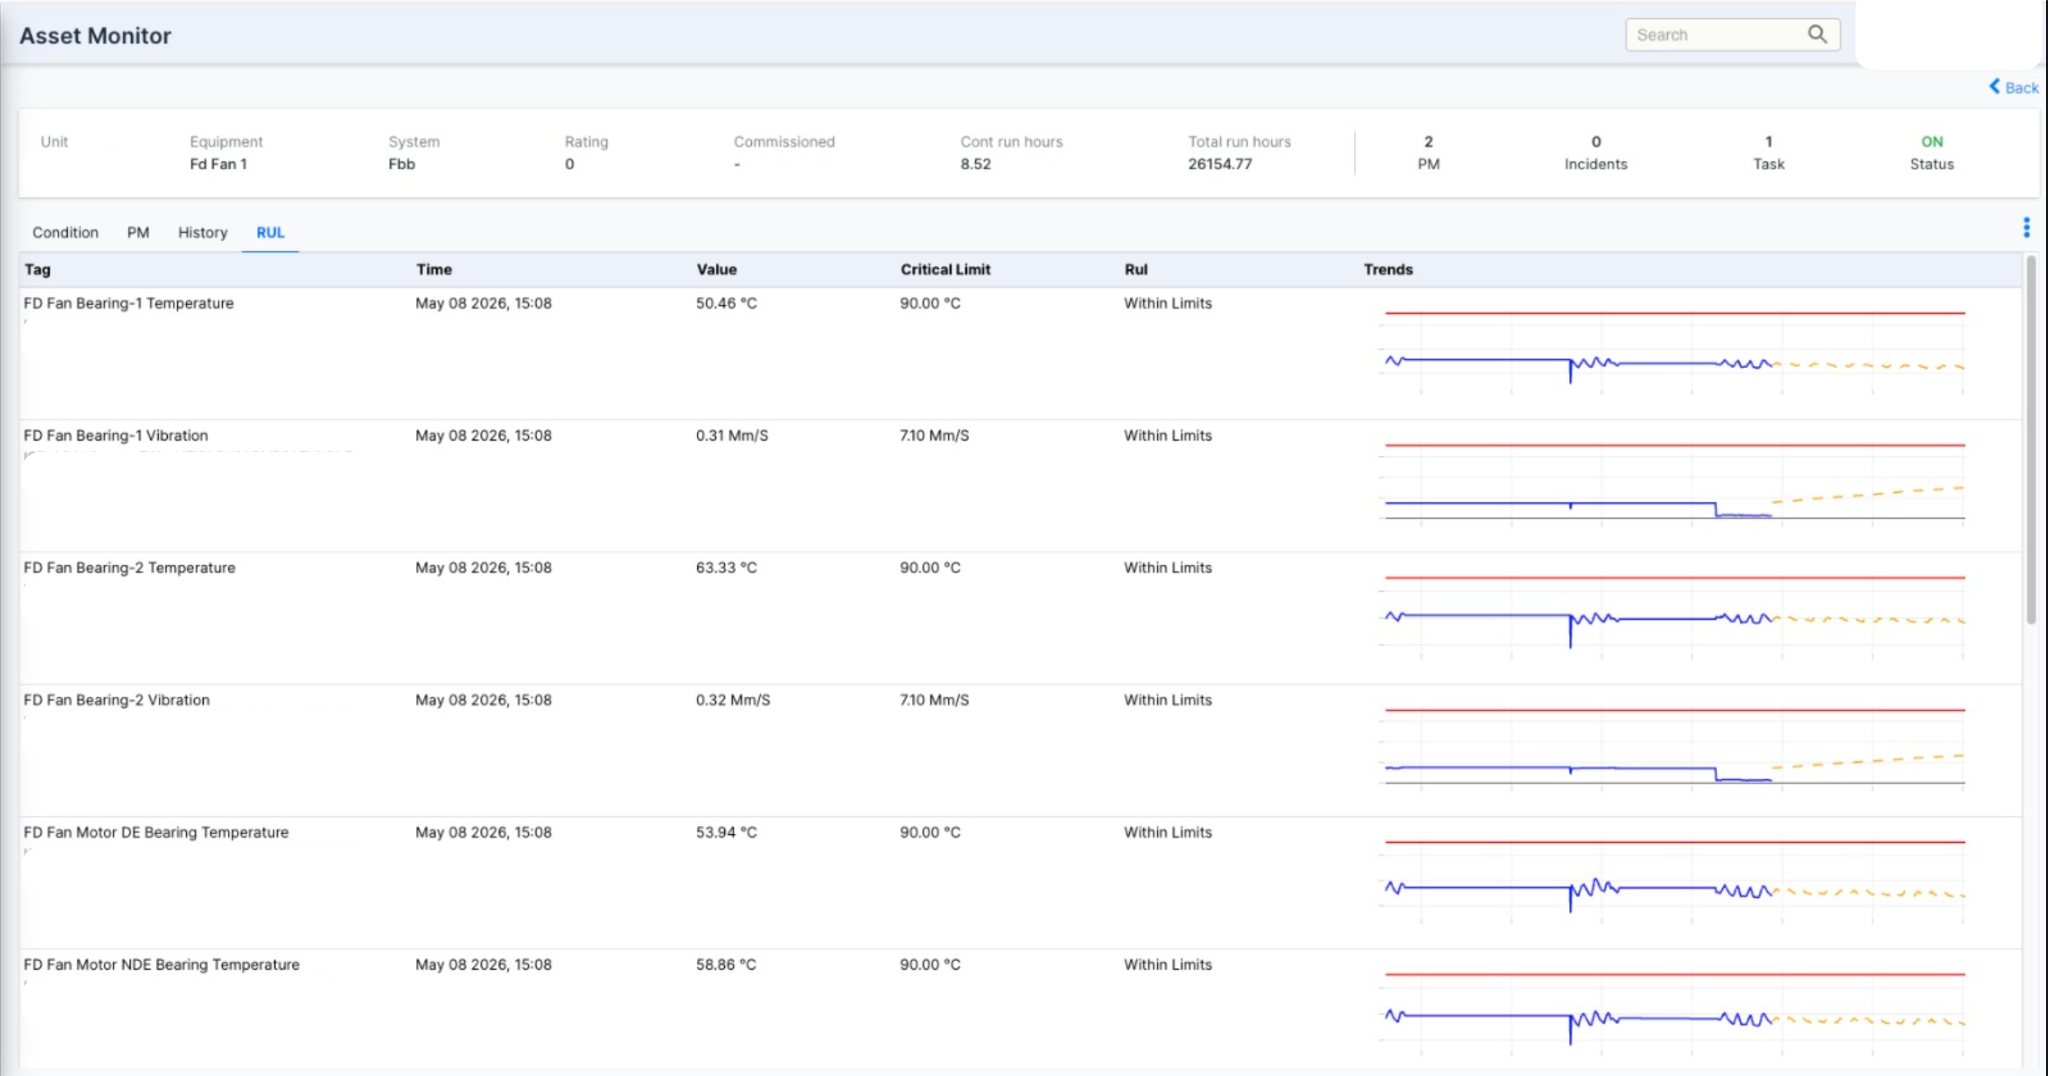
Figure 1. RUL Dashboard — Temperature and Vibration Tag Summary
¶ Key Concepts
Table 1. Key Concepts and Terms
| Term | Description |
|---|---|
| Remaining Useful Life (RUL) | The estimated number of hours before a monitored sensor tag is forecast to reach its defined critical limit. |
| Critical Limit | The maximum allowable value for a given sensor tag, as specified by the client during the onboarding process. Exceedance of this limit indicates an abnormal or unsafe equipment condition. |
| Training Window | The 30-day historical data period used to train the forecasting model at each retraining cycle. |
| Forecast Horizon | The 15-day forward-looking prediction period generated by the trained model. |
| Load Bucket | A defined range of equipment load values used to segment operational conditions for vibration normalisation purposes. |
| Trained Data | Historical sensor readings forming the basis of the forecasting model, displayed as a blue line in the trend chart. |
| Predicted Data | Forecasted sensor values for the next 15 days, displayed as an orange dashed line in the trend chart. |
¶ Data Collection and Pre Processing
When the module runs, it fetches the last 30 days of hourly average data for each configured tag. Before this data is used to train the forecasting model, all shutdown periods and other non-operational intervals are removed. This ensures that the model is trained only on data that represents the equipment in active operation.
¶ Forecasting Model
The module uses a package called Prophet to perform the forecasting. The model is trained twice a day — at the 0th hour (midnight) and at the 12th hour (noon). At each of these intervals, the system fetches the latest 30-day data window, trains a fresh model, and saves the trained model in the Attachment API.
Between the two daily retraining cycles, the system generates an updated forecast every hour using the model that was most recently trained. This means the platform reflects a current forecast at any point during the day, while the model itself is refreshed twice daily to incorporate the latest data.
If the operational pattern changes — for example, if there is a drop in temperature or a shift in trend — the next retraining cycle will pick up that change and the forecast will adjust accordingly.
¶ Temperature Analysis
¶ Daily Seasonality
Temperature data exhibits a daily seasonality pattern: values tend to rise in the afternoon and come back down through the evening. The Prophet model captures this daily pattern as part of its forecasting.
¶ Weather Temperature Adjustment
Since the equipment is rotary in nature, ambient weather temperature has an influence on the equipment temperature readings. To account for this, the module does not forecast the raw equipment temperature directly. Instead, it subtracts the weather temperature from the actual equipment temperature to produce a difference value, and it is this difference that is forecasted.
To bring the forecast back to the original temperature scale for display, the module separately forecasts the weather temperature for the next 15 days and adds it to the forecasted difference. The result is the final predicted equipment temperature for the 15-day forecast horizon.
¶ Vibration Analysis
¶ Load Dependency
Unlike temperature, vibration does not have a daily seasonality pattern. Instead, vibration depends on the operational load of the equipment — when the load increases, the vibration also increases. Forecasting raw vibration values directly would therefore produce misleading results, as any increase in load would appear as an upward trend.
¶ Load Bucket Median Normalisation
To address this, the module normalises the vibration data using a load bucket approach. Load values are grouped into defined ranges, referred to as load buckets (for example, load values between 10 and 40). For each load bucket, a benchmark median vibration value has been established. This median is sourced from a benchmark run conducted for the tag and does not change unless a new benchmark is run.
For each data point in the training window, the actual vibration value is subtracted from the median of the load bucket it falls within. This produces a normalised difference series, which is what the Prophet model is trained on.
After forecasting this difference, the last known load bucket median — that is, the median corresponding to the load bucket in which the most recent data point falls — is added back to the forecasted difference. This reconstructs the forecast in the original vibration unit scale for display.
Note: The three limit crossing scenarios described above are mutually exclusive for any given tag at any given forecast cycle. The system will display only one status at a time, reflecting the most current assessment based on the available trained data and forecast output.
¶ RUL Output and Status
After each forecast cycle, the system compares the forecast values against the critical limit for each tag. Based on this comparison, one of three statuses is assigned to the tag:
Table 2. RUL Output and Status
| Status | Condition and Behaviour | Realtime Graph |
|---|---|---|
| Within Limits | The forecasted values for the next 15 days do not reach or cross the critical limit. The equipment is considered to be operating within acceptable parameters. |
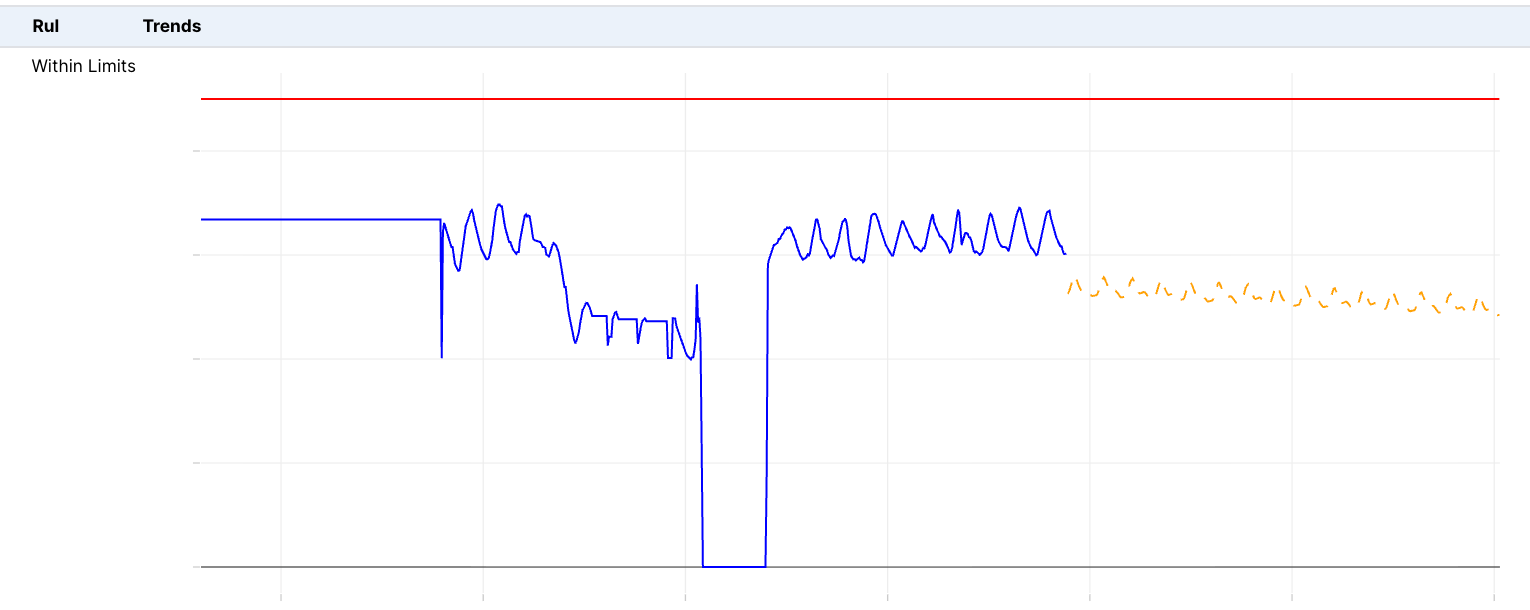
Figure 2. RUL Output and Status
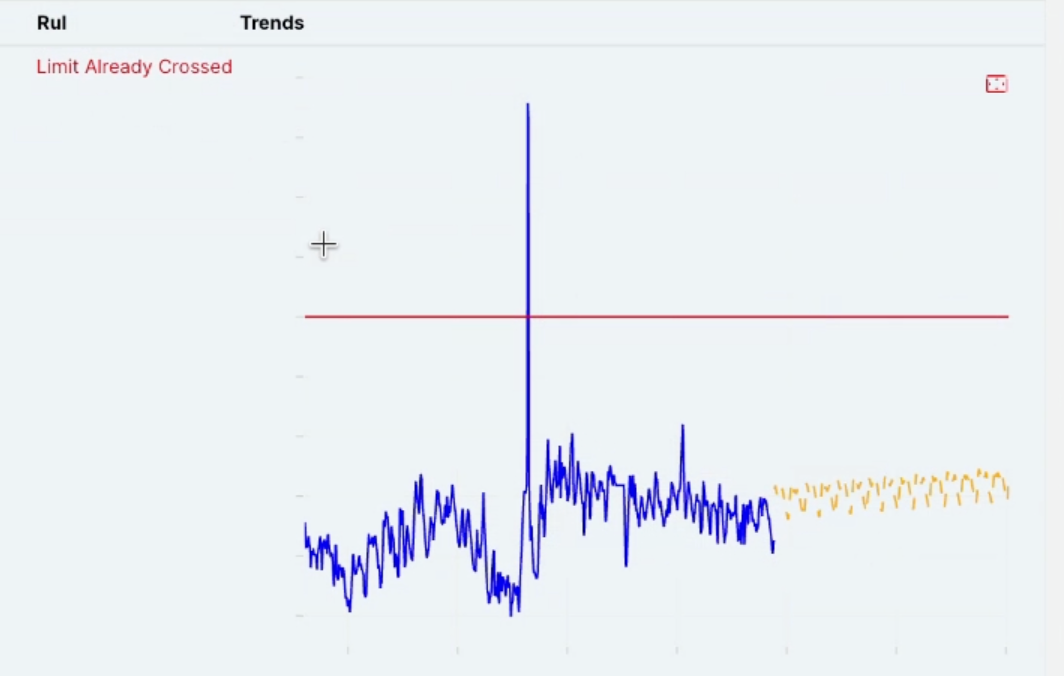
Figure 3. RUL Output and Status (continued)
The forecast does not predict shutdown events. The system extrapolates the trend observed in the last 30 days into the forecast horizon. If the trend has been increasing, the forecast will continue to increase. If a linear increase in the data reflects a developing issue with the equipment, the forecast will reflect that continuation and may eventually reach the critical limit.
¶ Screen Description (Graphs)
¶ RUL Tab - Asset Level Overview
The RUL tab displays a list of all configured tags for the selected asset. Each row in the table represents one tag and presents the following columns: Tag (identifier and system path), Time (timestamp of the last recorded value), Value (the current sensor reading), Critical Limit (the client-defined threshold), RUL (the current status as described in Section 7), and Trends (an inline chart showing the historical and forecasted values).
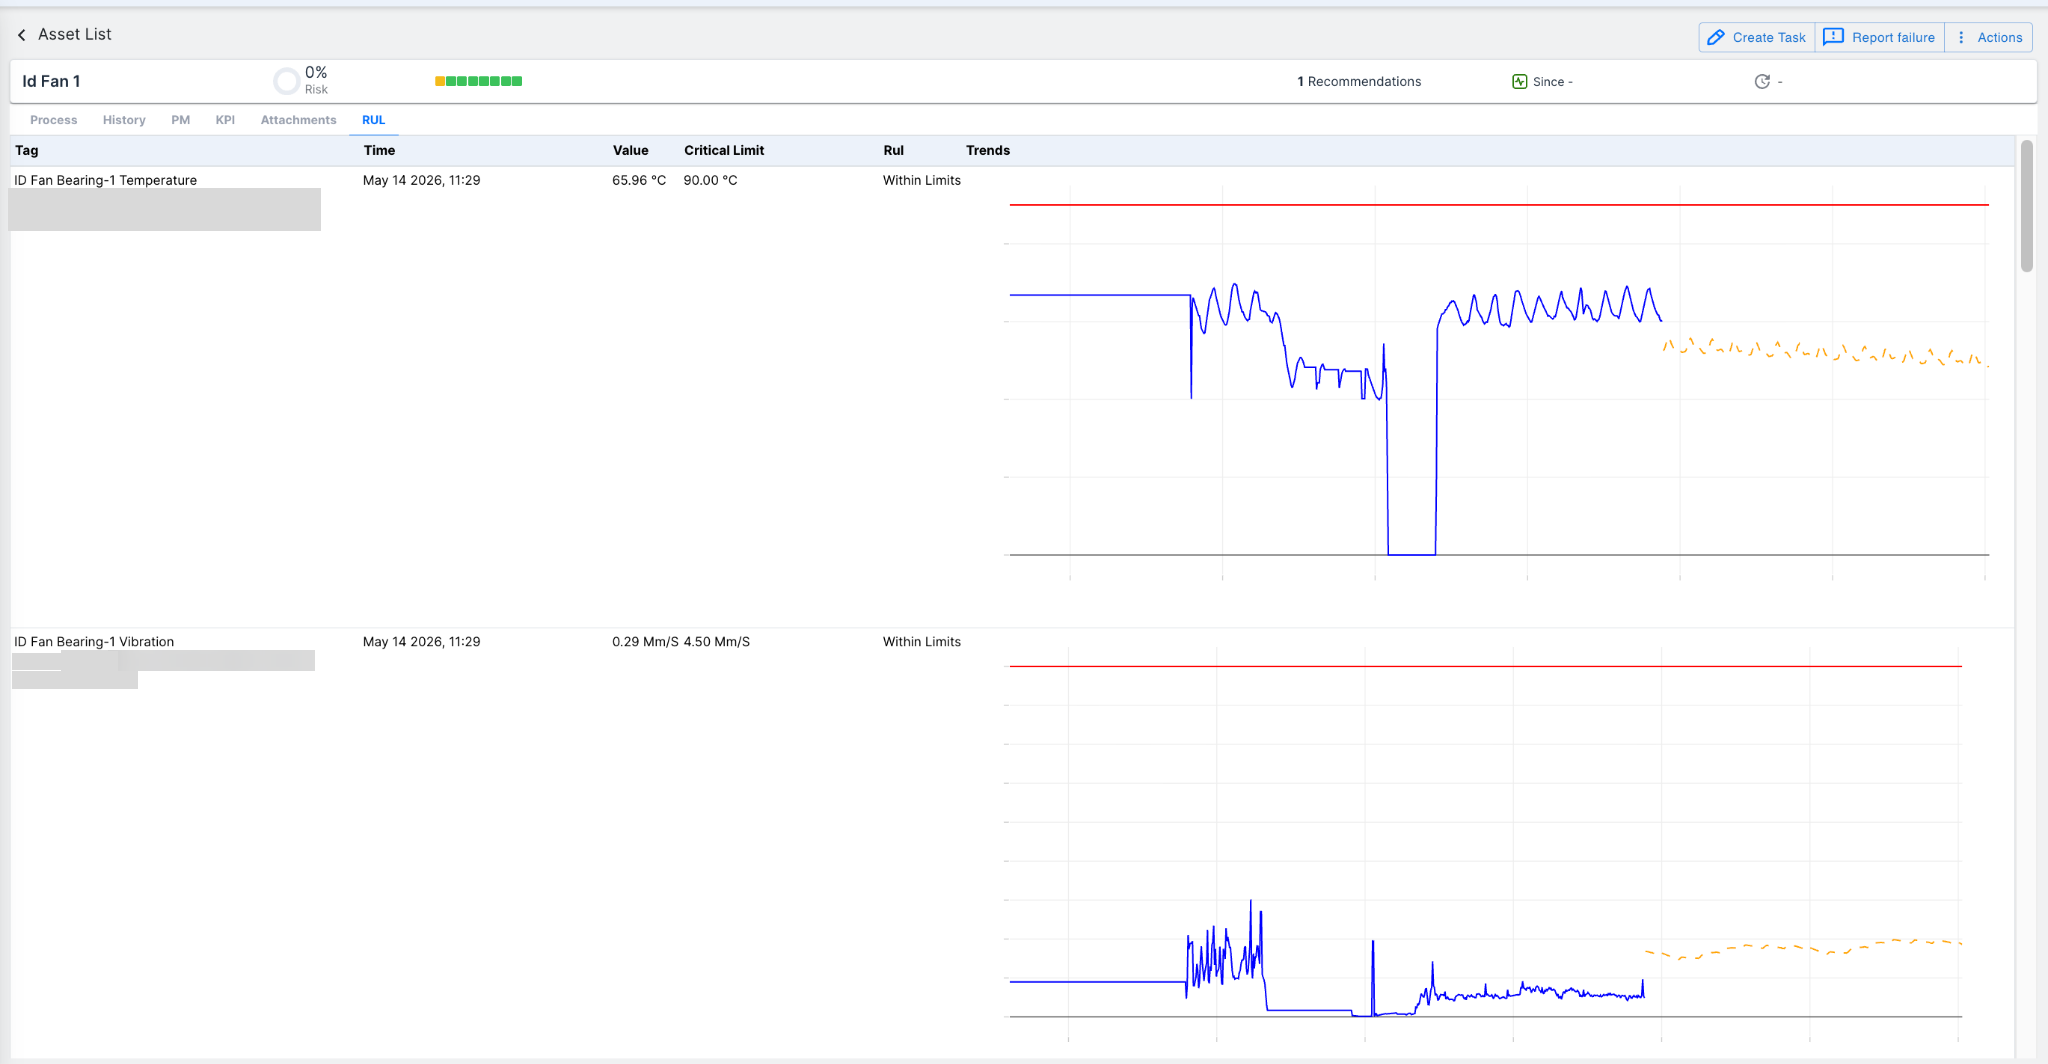
Figure 4: RUL Tab — Id Fan 1: Temperature and Vibration Tag Summary
Figure 1 shows the RUL tab for the asset Id Fan 1. Two tags are displayed: ID Fan Bearing-1 Temperature with a current value of 65.96 °C against a critical limit of 90.00 °C, and ID Fan Bearing-1 Vibration with a current value of 0.29 Mm/S against a critical limit of 4.50 Mm/S. Both tags show a status of Within Limits. The inline trend charts on the right of each row show the blue trained data line and the orange dashed predicted data line, with the red horizontal line marking the critical limit.
¶ Trend Chart- Trained Data and predicted Data
The trend chart can be expanded to display the full historical and forecast series. The blue line represents the 30-day trained data. The orange dashed line represents the 15-day predicted data. The red horizontal line marks the critical limit. Hovering over any point on either line displays a tooltip with the exact timestamp and sensor value.
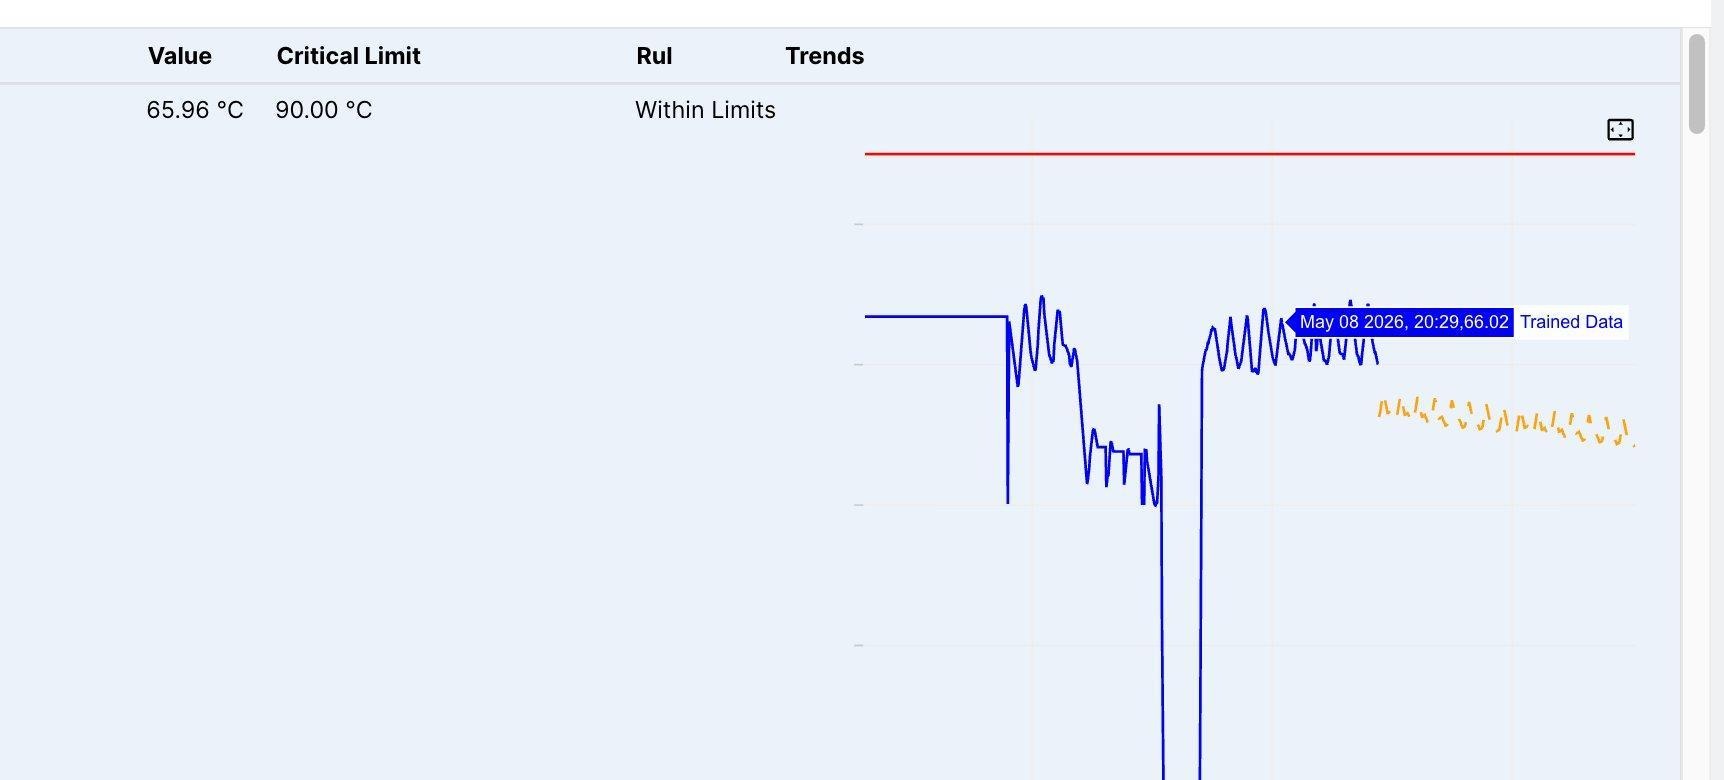
Figure 5: Expanded Trend Chart — Trained Data Tooltip (ID Fan Bearing-1 Temperature)
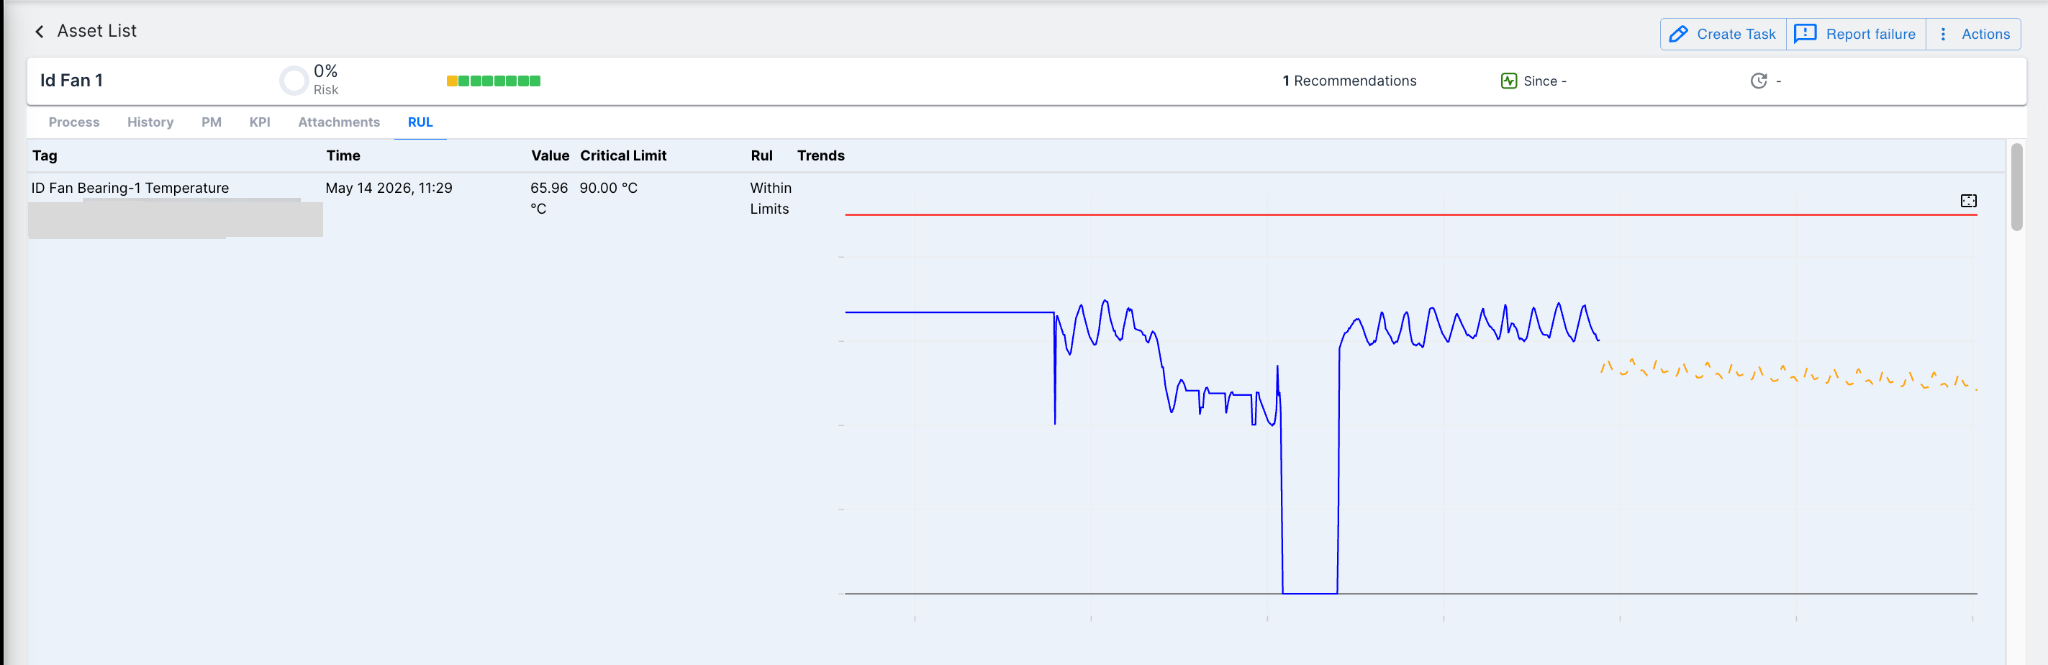
Figure 6: Expanded Trend Chart — Trained Data Tooltip (ID Fan Bearing-1 Temperature)
Figure 4 shows the expanded trend chart for the ID Fan Bearing-1 Temperature tag with the tooltip active on the trained data series. The tooltip shows a value of 66.02 °C recorded on May 08, 2026 at 20:29. The blue line shows the equipment operating at a relatively stable level, with a sharp drop corresponding to a shutdown period, followed by a recovery. The orange predicted data line begins after the end of the trained data period.
¶ RUL Status- Limit Already Crossed
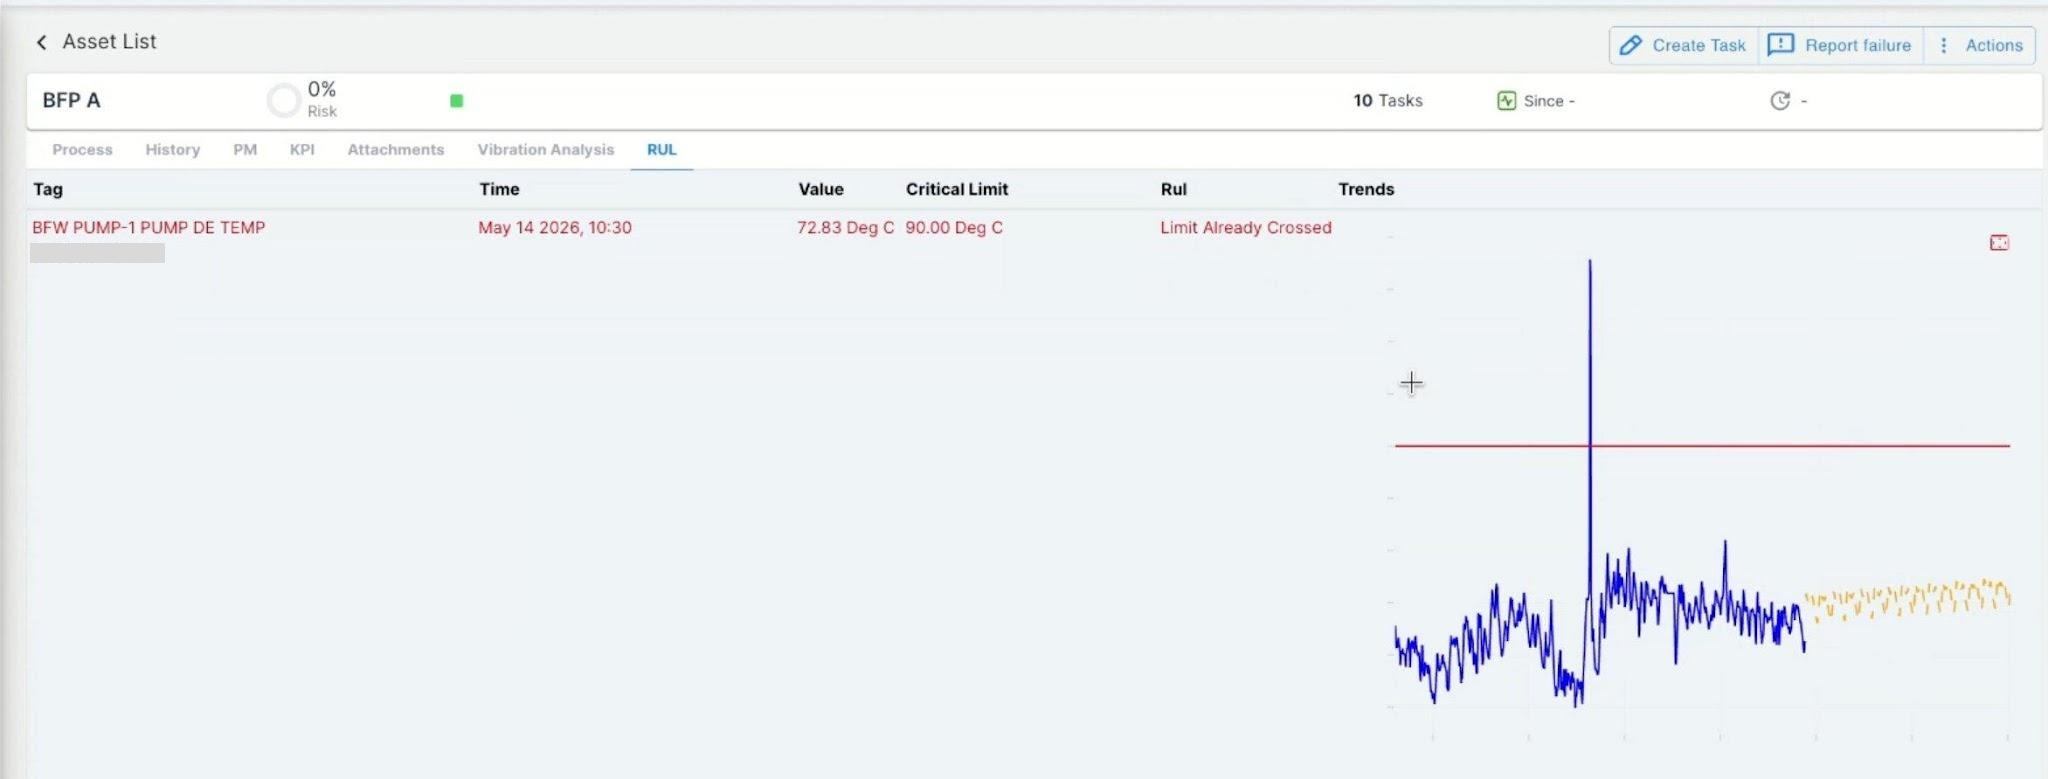
Figure 7: RUL Tab — BFP A: Limit Already Crossed Status for BFW Pump-1 Discharge End Temperature
Figure 6 shows the RUL tab for the asset BFP A. The tag BFW PUMP-1 PUMP DE TEMP displays a status of Limit Already Crossed, highlighted in red. The current sensor value is 72.83 Deg C against a critical limit of 90.00 Deg C. Although the current value is below the limit, the training data visible in the trend chart contains a spike that previously exceeded 90.00 Deg C, which is what triggers this status. As described in Section 7, this status persists once the historical data has breached the limit, regardless of the current value or forecast direction.
¶ User and System Action
¶ User Actions
¶ User Actions
| User Action | Expected System Response |
|---|---|
| Navigate to the RUL tab on an asset detail page. | The system displays the RUL summary table listing all monitored tags, with current values, critical limits, RUL status, and inline trend charts. |
| Expand the trend chart for a specific tag. | The system renders the full-size trend chart displaying the 30-day trained data (blue line), 15-day forecast (orange dashed line), and the critical limit (red line). |
| Hover over a data point on the trend chart. | A tooltip appears displaying the exact timestamp and sensor value for the selected data point, with a label identifying it as Trained Data or Predicted Data. |
| Review the RUL column for a tag. | The column displays one of: Within Limits, Limit Already Crossed (in red), or an hour count indicating the time remaining before the forecasted value is expected to breach the critical limit. |
| Create a task via the Create Task action. | The system initiates a task creation workflow (standard APM platform functionality, outside the scope of this document). |
| Report a failure via the Report Failure action. | The system initiates the failure reporting workflow (standard APM platform functionality, outside the scope of this document). |
¶ System Actions (Automated)
| System Event | Action Performed |
|---|---|
| 0th hour (midnight) trigger | The system fetches the last 30 days of hourly averaged sensor data for all configured tags, preprocesses the data (removes shutdown periods), trains a Prophet model for each tag, and persists the trained model via the Attachment API. |
| 12th hour (noon) trigger | Identical to the 0th hour process. A fresh model is trained on the updated 30-day data window. |
| Hourly interval (between retraining cycles) | The system uses the most recently trained model to generate an updated 15-day forecast for each configured tag and evaluates the forecast against the critical limit to update the RUL status. |
| Benchmark update event | If the client updates vibration benchmark median values, the system incorporates the revised medians into the next preprocessing and training cycle. |
¶ Limitations
| Limitation | Detail |
|---|---|
| Tag type restriction | The module covers temperature and vibration tags only. Other parameter types are outside the current scope. |
| Equipment type restriction | The module applies to rotary equipment only. |
| Load outside bucket range | If a load value exceeds the defined bucket ranges, the normalisation step for vibration cannot be applied correctly for that data point. This is not currently handled. |
| No shutdown prediction | The module does not predict future shutdowns. It forecasts the continuation of the observed operational trend. |
| 15-day forecast horizon | The forecast extends 15 days ahead only. Equipment conditions beyond this horizon are not assessed. |
| Benchmark median is static | The load bucket median values used in vibration normalisation are sourced from a benchmark run and do not change unless a new benchmark is conducted. |
¶ Conclusion
The RUL Module provides maintenance and operations teams with a quantified estimate of how long a monitored rotary equipment tag can continue operating before its critical limit is reached. By applying weather temperature adjustment for temperature tags and load bucket median normalisation for vibration tags, the module isolates the underlying equipment behaviour from environmental and operational variability before generating its 15-day forecast. The twice-daily model retraining cycle ensures that the forecast reflects the most current operational conditions, while the three-status output — Within Limits, Limit Already Crossed, or a specific hour count — gives teams a clear basis for maintenance prioritisation.