1. What are Assets?
Assets refer to any critical equipment or machinery used in industries, power plants, oil and gas extraction plants, thermal plants, or other industries. These assets which are industrial equipment like turbines, compressors, boilers, pumps, fans, mills, and more need to be monitored for their health, performance, and maintenance needs regularly.
To reach Asset Monitor Page→ Login to Pulse → Click on Ops Center→ Click on Asset Monitor
You will be redirected to the asset monitor page of Pulse
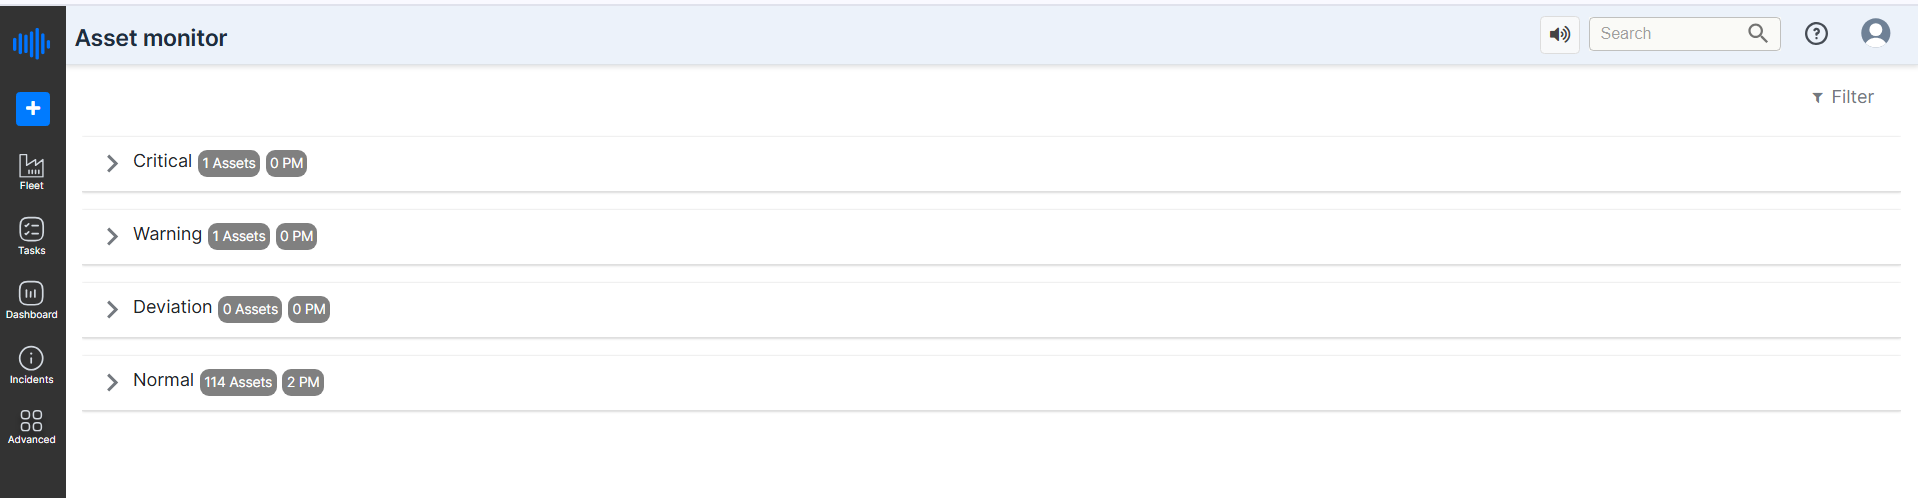
Figure 1. Asset monitor page-Pulse
¶ 2. Why is the Asset Monitor Module Needed?
Industries rely heavily on machinery to maintain productivity. Unplanned breakdowns can result in huge operational losses, safety risks, and increased maintenance expenses. The Asset Monitor module provides a centralized dashboard to analyze the health of all assets in the plant. This helps simplify the job of the maintenance teams by allowing them to focus on assets with poor health conditions. Asset monitor module helps teams to
- Monitor Asset Health in Real-Time – Identify failures before they happen.
- Classify Assets by Criticality – Understand which machines need immediate attention and send an alert.
- Track Incidents and Maintenance History – Keep records of past failures and preventive maintenance.
- Plan and Schedule Maintenance – Ensure that assets receive timely servicing.
- Improve Operational Efficiency – Reduce downtime and increase asset lifespan through predictive insights.
The critical parameters that the module considers to provide accurate analysis are - temperature, vibration, current, flow/press, etc. For instance, let's consider the temperature of a bearing in one of the assets. The temperature may vary due to various factors like changes during different times of the day, changes due to varying operational speeds, or changes in the ambient temperature during the day. Given such fluctuations in the temperature in just a day, over a period of time, it would become practically impossible to predict the health of these moving parts.
The Asset Monitor tool also has provisions to report failures/maintenance activities, make field observations, schedule reminders for preventive maintenance (PM) tasks, or bring this information from CMMS systems to create a convenient environment for effective maintenance.
The Pulse Platform's Asset Monitor allows users to analyze and view the number of assets that are in critical, warning, or deviation phases, run normally, and need predictive maintenance. In addition to monitoring, the screen allows you to add new assets to a selected unit.
For example in Figure 1
- 1 asset falls under critical
- 1 Asset falls under Warning
- 0 Assets fall under deviation and
- 114 assets run normally
To view the health condition of the tags assigned to an asset, the trends for the current day, the previous day, or over the past week, the past PM activities, the history of incidents on the assets,
- Click the button displaying the number of assets beside the monitoring category (Critical, Warning, Deviation, Normal).
The screen expands to show a grid that displays the health condition of each asset under this category, the number of incidents and PMs, the dates of next PM and last PM.
¶ 3. Filter Button
Users can filter the assets by Units, Asset category, or System and sort them in order by or Group by options. To do this, click the Filter icon at the top right corner of the screen. Add in the desired details and Click on “Apply”. Click on “Clear All” to clear old filters and add new ones.
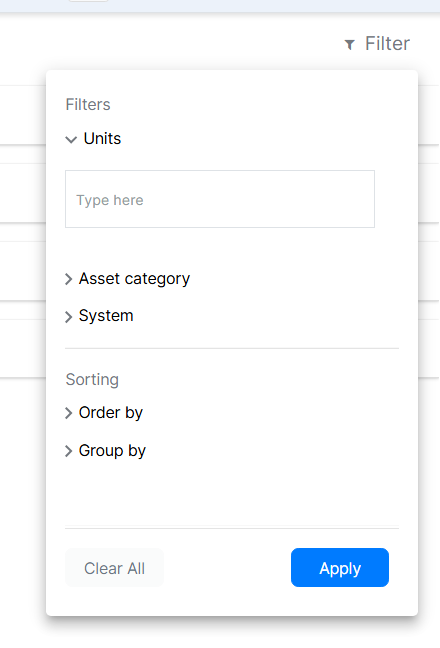
Figure 2. Filter Option
¶ 4. Overview of the Asset Monitor Dashboard
Based on real-time data and predictive analytics, the Asset Monitor dashboard categorizes assets into different health states. The categories are:
¶ 4.1 Critical Assets
- These are assets that are in a critical state and need immediate attention.
- Click on the dropdown near Critical to expand and check the assets under the “Critical” category.
- If an asset is in this category, it means its health indicators suggest an upcoming failure or severe degradation and need to be addressed as soon as possible to avoid shutdowns.
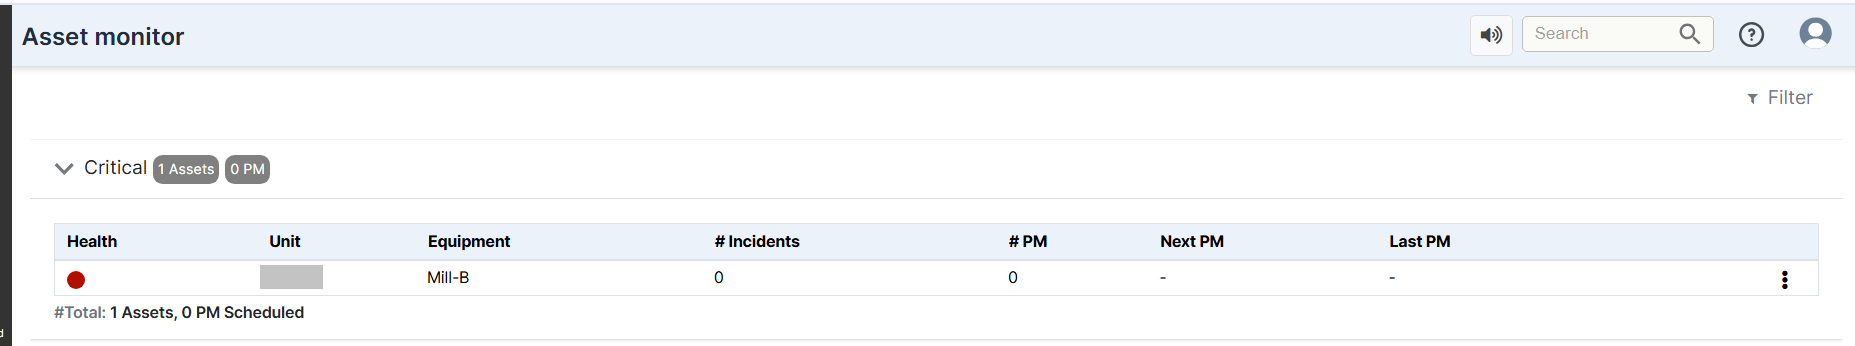
Figure 3. Critical Assets list
¶ 4.2 Warning Assets
- These assets are showing early warning signs of potential issues that may become critical in the future if not addressed timely.
- Maintenance teams should proactively check these to prevent them from becoming critical.
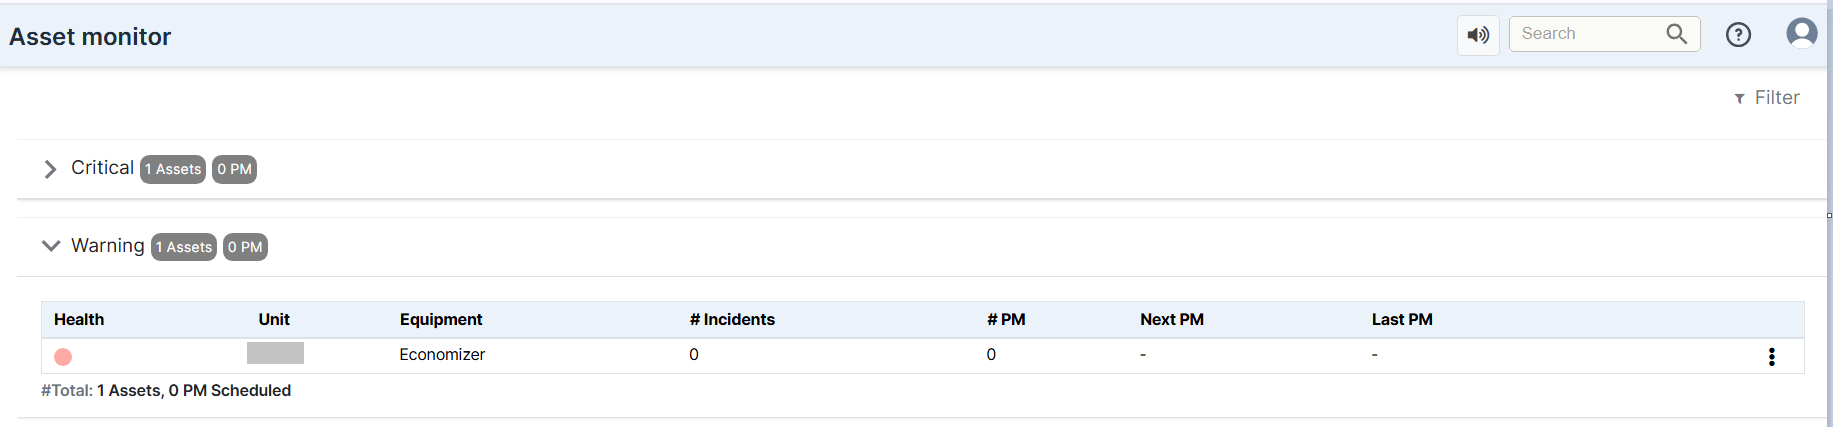
Figure 4. Warning Asset list
¶ 4.3 Deviation Assets
- These assets have minor deviations from expected performance values.
- Click on the dropdown near deviation to expand and check the assets under the “Deviation” category.
- These deviations may not require immediate attention but should be monitored.
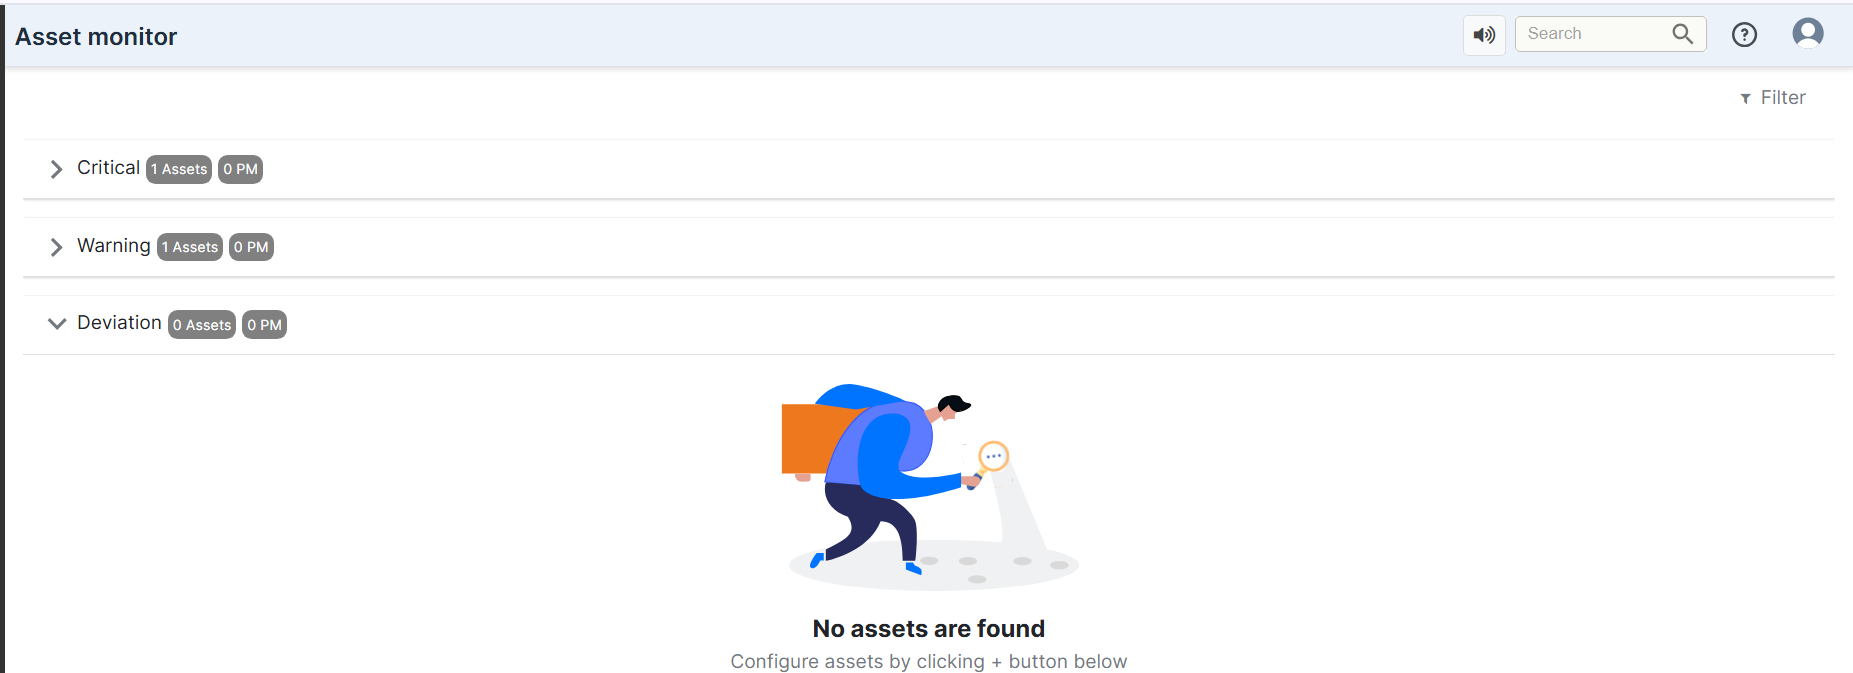
Figure 5. deviated assets list
In the above case, there are no deviations seen.
¶ 4.4 Normal Assets
- Assets operating within their normal parameters.
- Click on the dropdown near Normal to expand and check the assets under the “Normal” category.
- No immediate action is required, but continuous monitoring ensures optimal performance. The below image shows a list of assets working optimally.
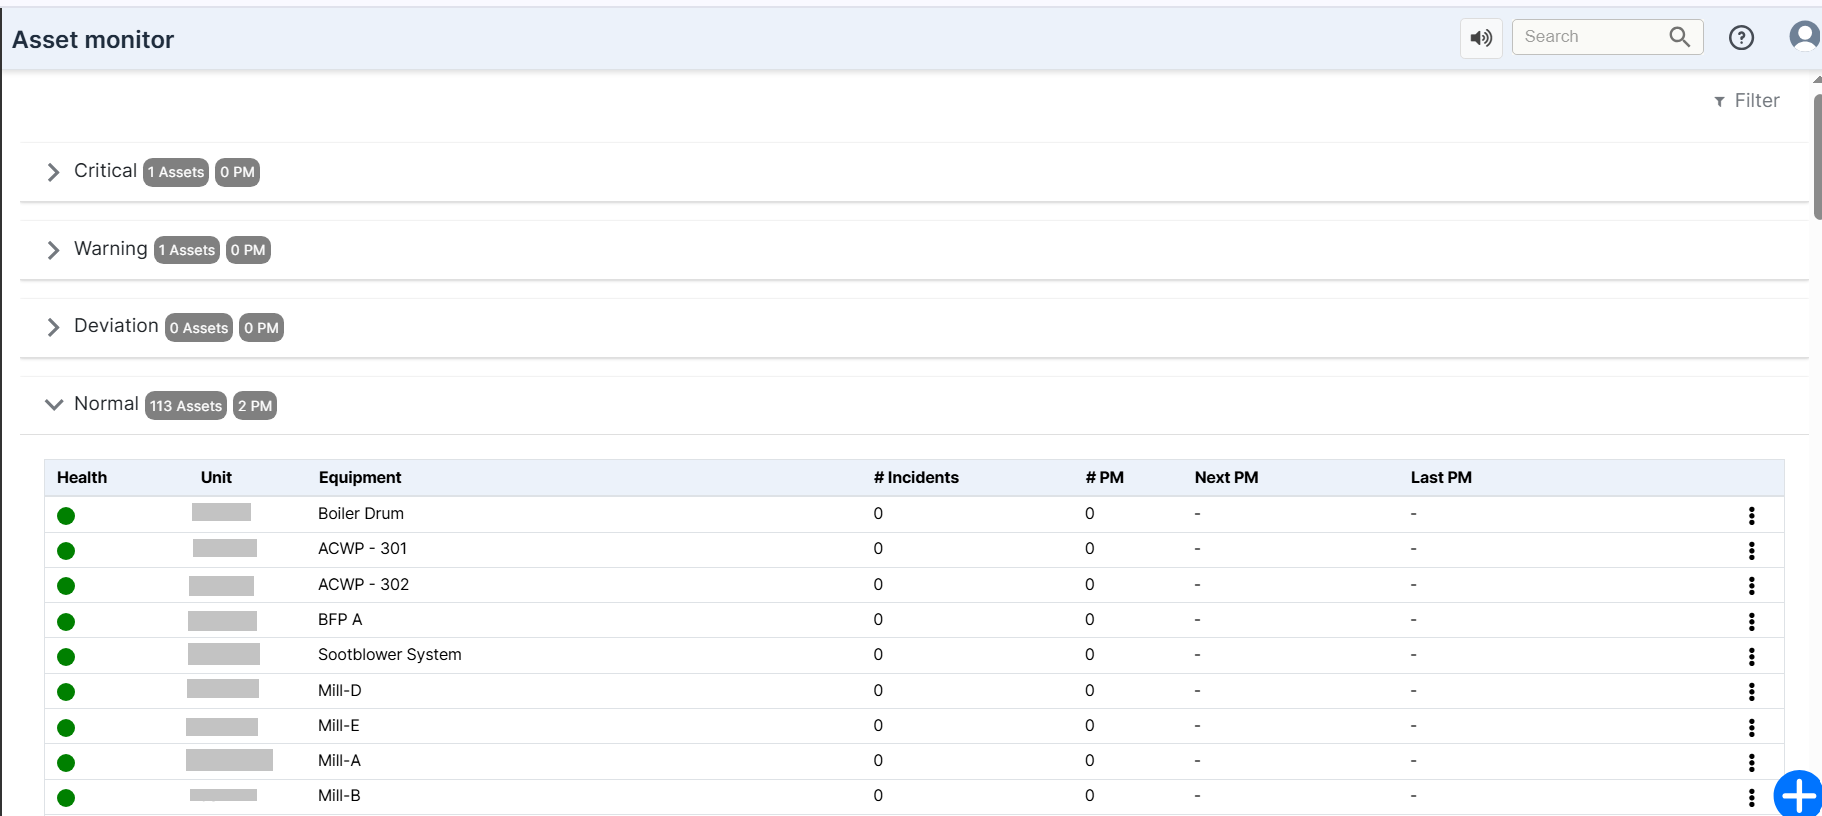
Figure 6.List of Normal Assets for all units
¶ 5. Key Features of the Asset Monitor Module
- Health Monitoring:
- Provides a color-coded status of each asset (Green = Normal, Yellow = Warning, Red = Critical).
- Equipment and Unit Details:
- Displays information such as the asset’s name, associated unit name, and equipment type.
- Incident Tracking:
- Keeps a record of past failures and reported incidents to analyze trends and patterns.
- Preventive Maintenance (PM) Scheduling:
- Tracks the number of preventive maintenance (PM) activities performed.
- Displays the next scheduled PM and the last PM date.
- Expandable Asset Categories:
- Users can expand and collapse different sections to view assets categorized under Critical, Warning, Deviation, or Normal states.
- Actionable Insights:
- The module provides maintenance teams with recommendations on which assets need immediate attention and which ones can be scheduled for routine checks.
¶ 6. How Pulse Empowers Industrial Operations with Asset Monitoring
By integrating real-time sensor data, machine learning models, and predictive analytics, Pulse ensures that industries can:
- Reduce unexpected failures by detecting issues early.
- Improve maintenance efficiency by prioritizing assets that need attention.
- Optimize asset utilization by keeping machines in peak operational condition.
- Enhance safety by preventing critical failures that could cause hazardous situations.
Asset monitor module also helps users to
- Create TAsk
- Make Observations, and
- Report failure
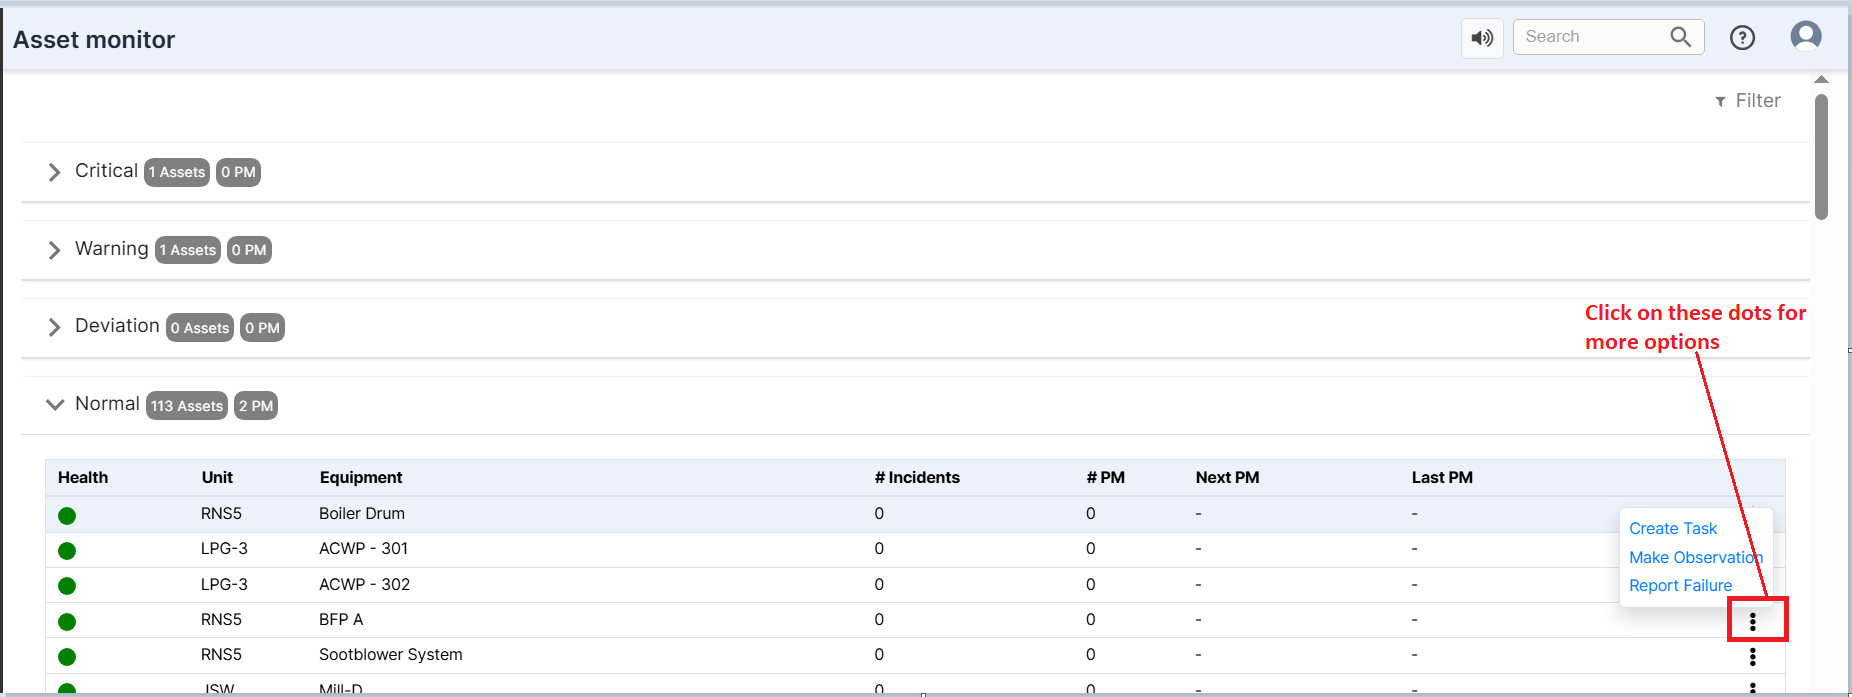
Figure 7. Asset Monitor features
¶ 7. Create Task
Clicking on Create Task, allows the user to create a new task for that unit and equipment.
Users can do the following while creating a new task
- Write the name of the task
- assign a date and time for this task to be completed
- Add sub-task
- Add the name of the sub-task
- Add the date and time for this sub-task to be completed
- Assign a user for a sub-task
- delete the sub-task
- Add team name- which team does this task belong to
- Add the status of this task- Started, Deferred, In progress, or Done
- Add priority level of this Task- Low, Medium, High,
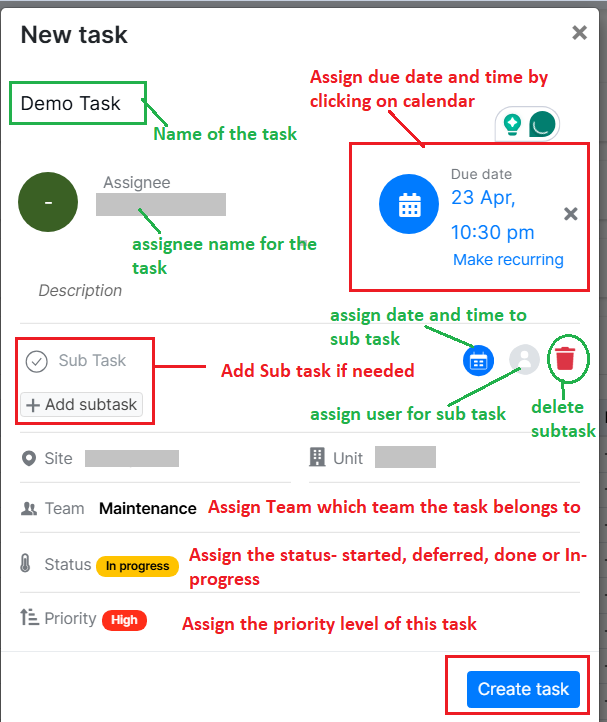
Figure 8. Craete New task
After entering all the details, the user can click on “Create Task” to create a new task.
Similarly, the user can click on “Make an Observation” fill in all the details for that observation as stated above, and click on Create to add a new observation.
To report a shutdown, click on the three dots next to a particular unit and equipment. Click on Report a Shutdown. A small window will pop up
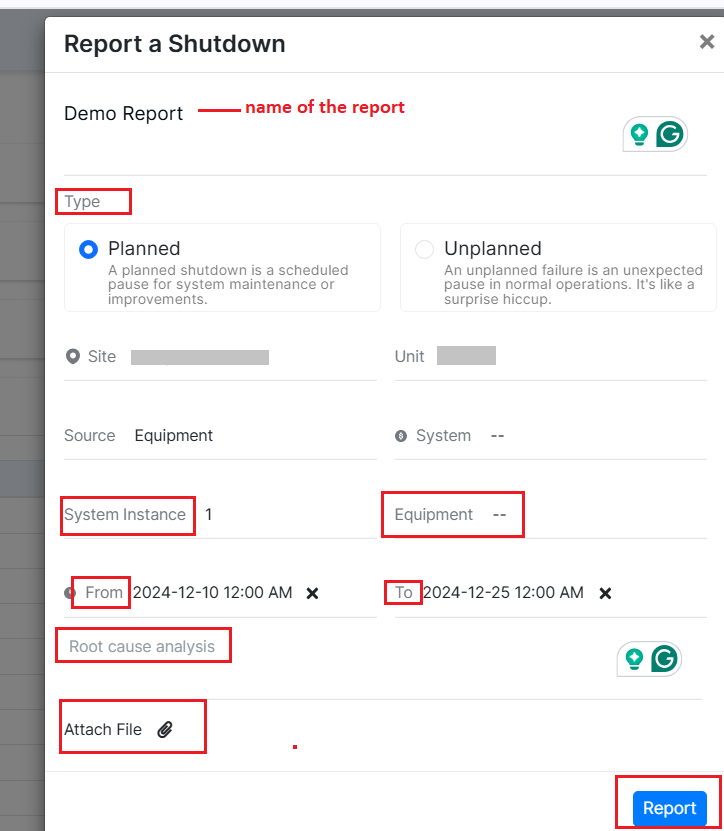
Figure 9. report a Shutdown
Fill in the details of the report-
- Name of the report
- Type of report- Select the Planned or Unplanned option-
- Planned shutdown- A planned shutdown is a scheduled pause for system maintenance or improvements.
- Unplanned shutdown- An unplanned failure is an unexpected pause in normal operations.
- Site, unit, source, equipment, system instance, and system
- Select the Date and Time of Failure (occurrence of an incident)/Shutdown.
- Root cause analysis- write any root cause analysis if required
- Attach file- If you have a document/image to support the reason for shutdown/failure of equipment, click the Folder icon beside Upload File and select it from your local disc. This can be data or graph files for analysis
- Click on Report to create a report and send it to that unit.
- Click Save. The record is listed in the History tab.
¶ 8. Adding or Modifying Assets
To add an asset,
- In the Asset Monitor screen, click the + icon at the bottom right. “Add an Asset” popup displays.
- Select the Unit from the drop-down list.
- Select the Equipment Category from the list. By default, the Sensors available for the top-most equipment category are displayed on the right side of the popup.
- Upon selection of the Equipment Category, all the equipment under the category is displayed with the option to select one or more. Select the relevant Equipment.
- Enter/Select the Name Plate details
- OEM (Original Equipment Maker) Name
- VFD - select Yes or No
- Date of commissioning the asset
- Last overhaul date, if applicable
- Motor KV
- Select Yes or No if Lab reports for Oil Analysis (Nash Value, Moisture, Viscosity, Metallic Impurities), Thermography, VIbration Spectrum, and Audio Sample are available.
- Click Save. The asset is listed under the Normal category until an incident occurs after which, it will be listed based on criticality.
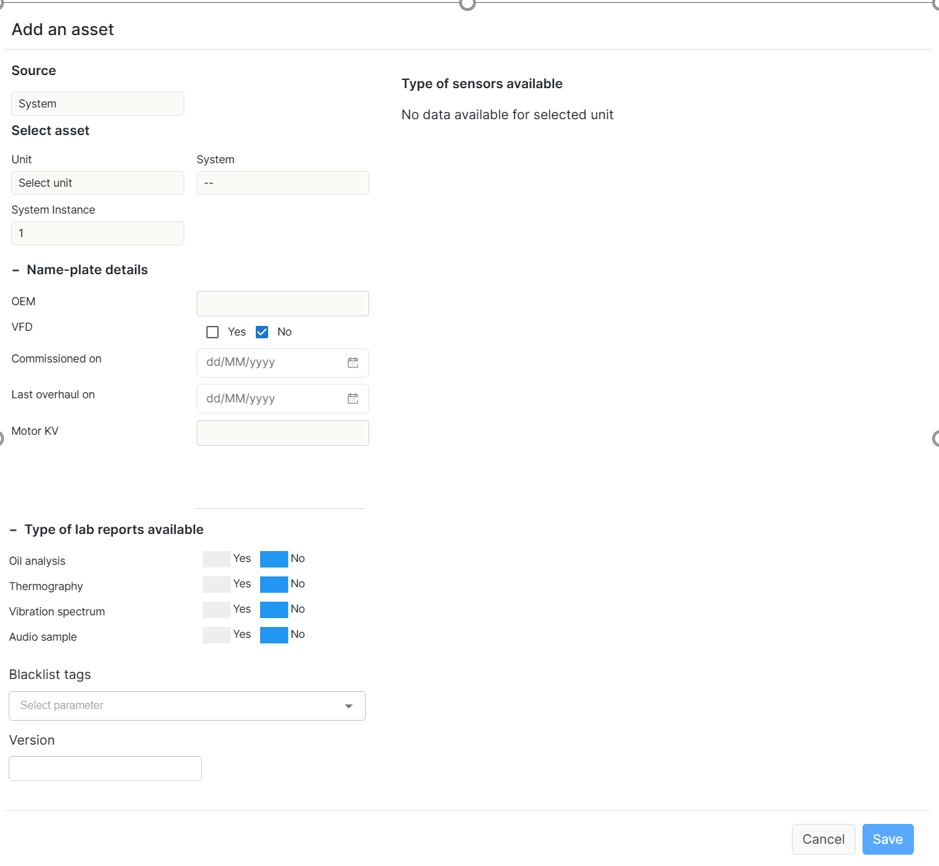
Figure 10. Add a new asset
Click on any equipment as shown in the figure below to see its details.
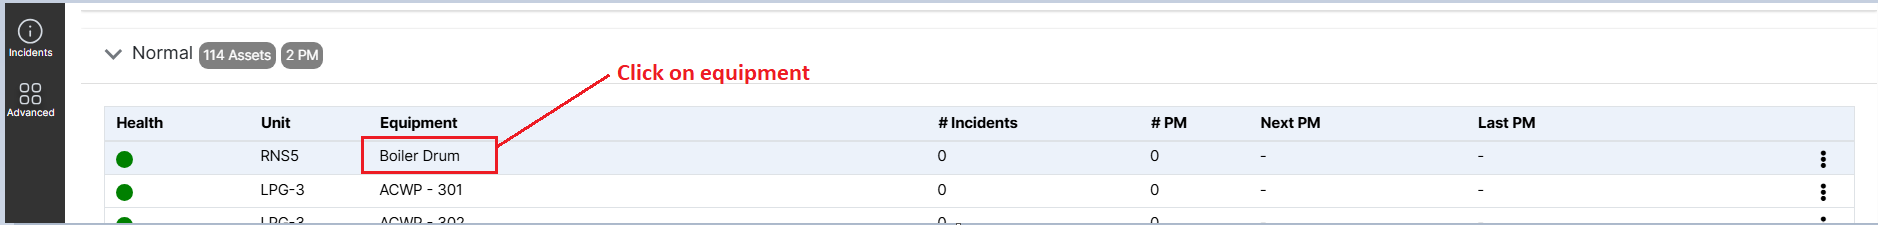
Figure 11. Click on Euipment
A new window will pop up [refer to the image below] where the user will get details of the asset selected. Users can perform multiple activities concerning the selected equipment in this new window.
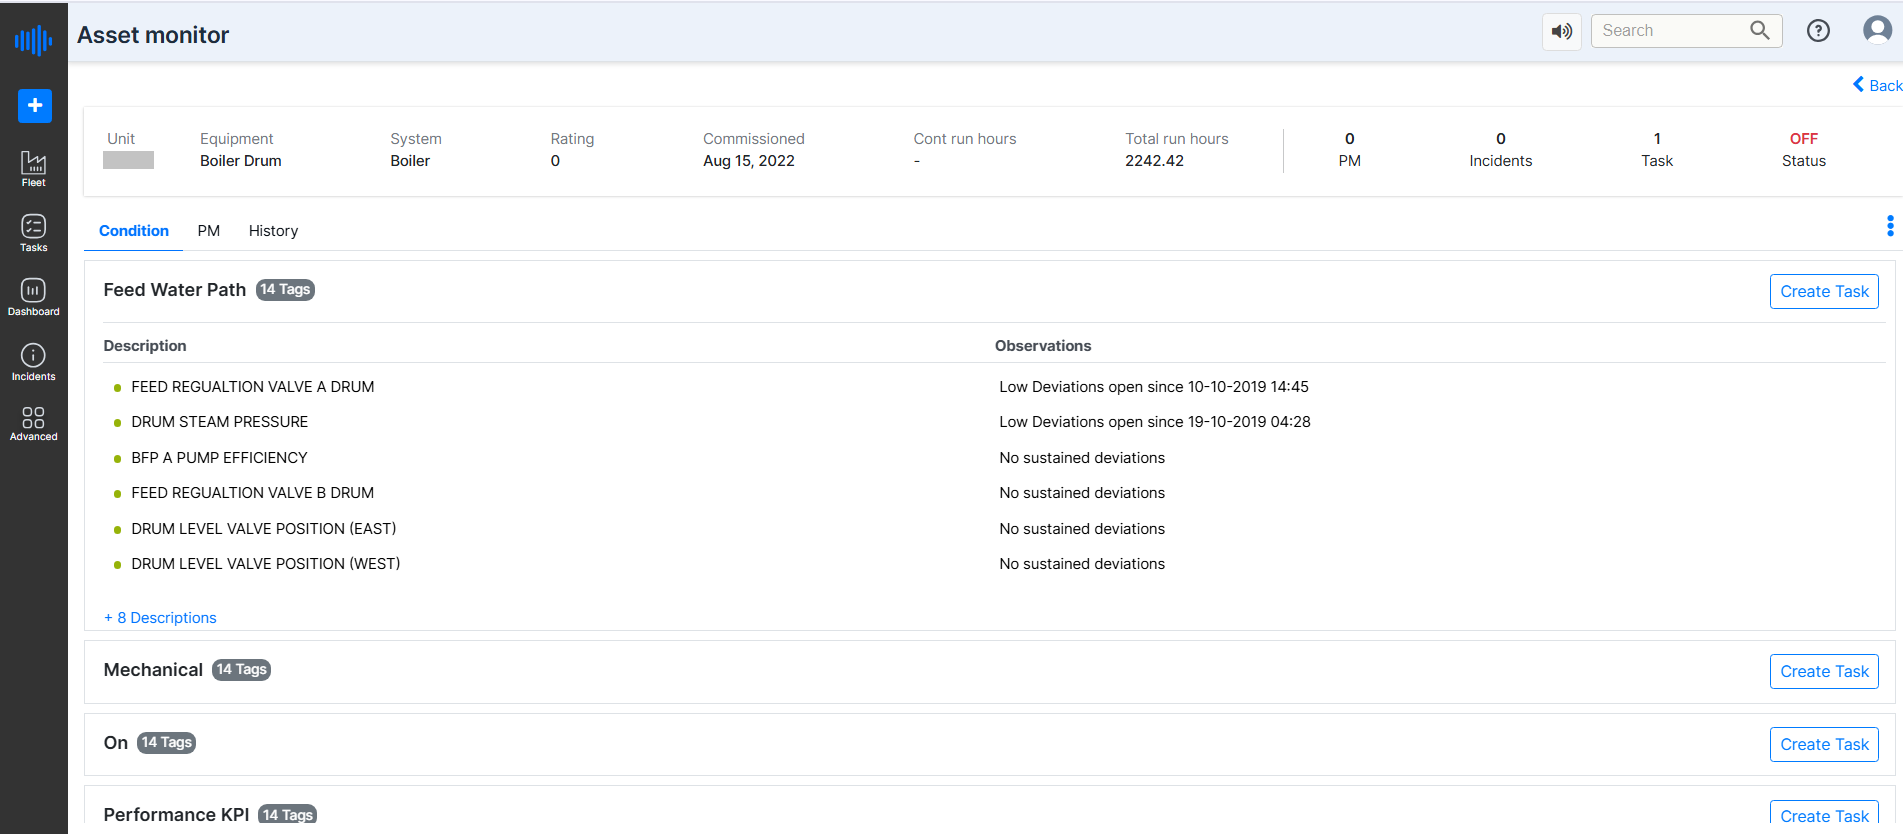
Figure 12. Details of selected asset
Click on any Description and observation user will get detailed information about the activity selected in graphical form. For reference, check the image below-
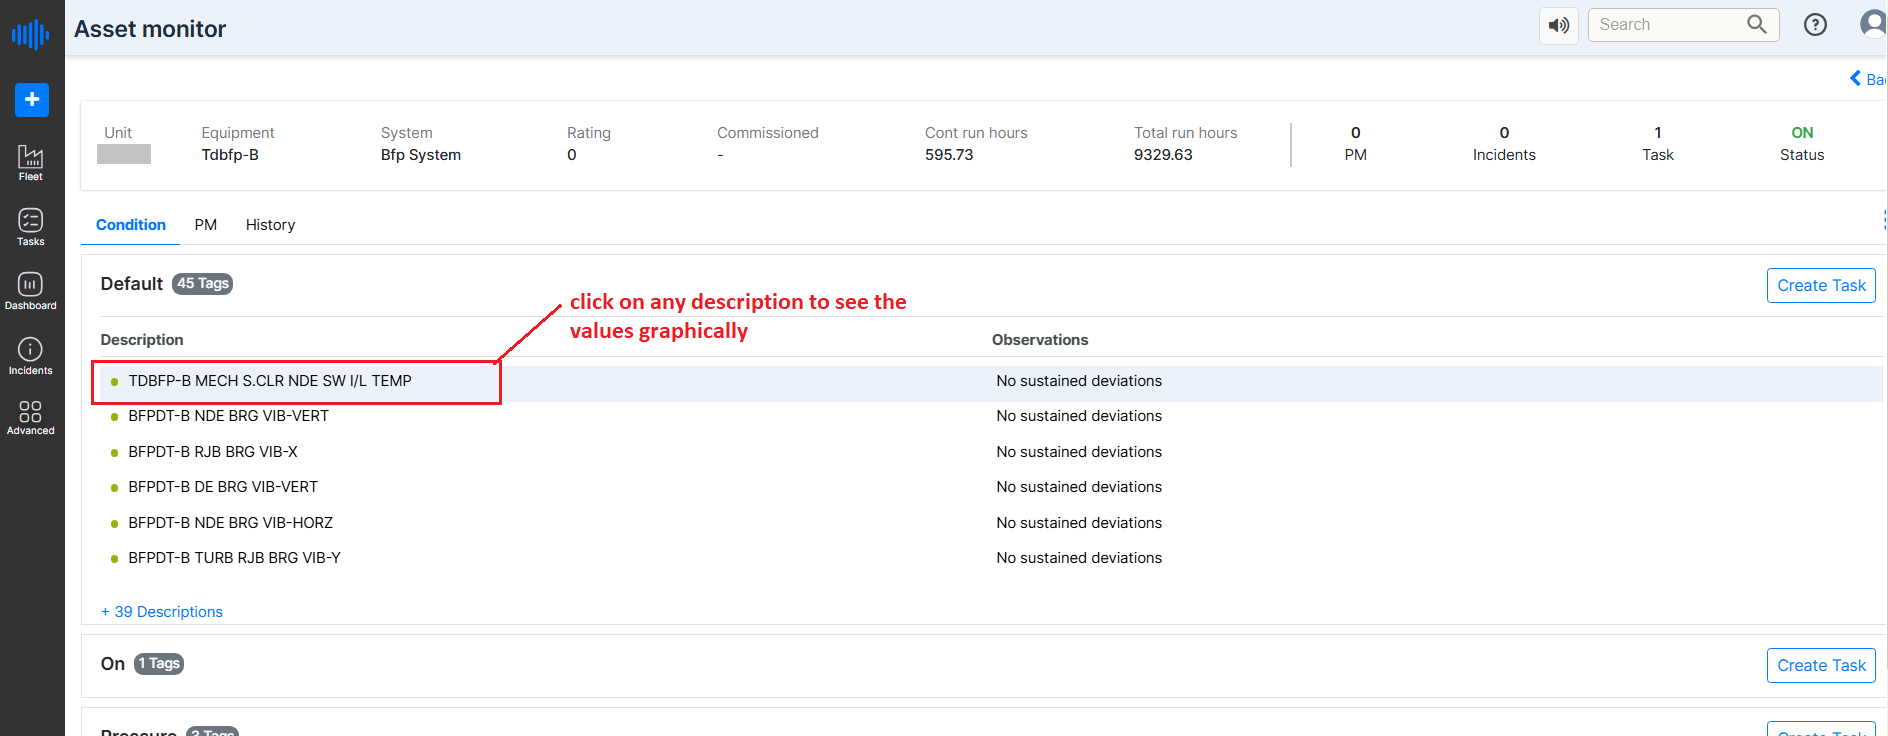
Figure 13. Details of asset description
On clicking, a new window pops up showing graphical details for the selected information
Here we have clicked to see information on TDBFP-B MECH S.CLR NDE SW I/L TEMP. Clicking here displays a new side window as shown below.
Let us understand the features and information users get from this new window.
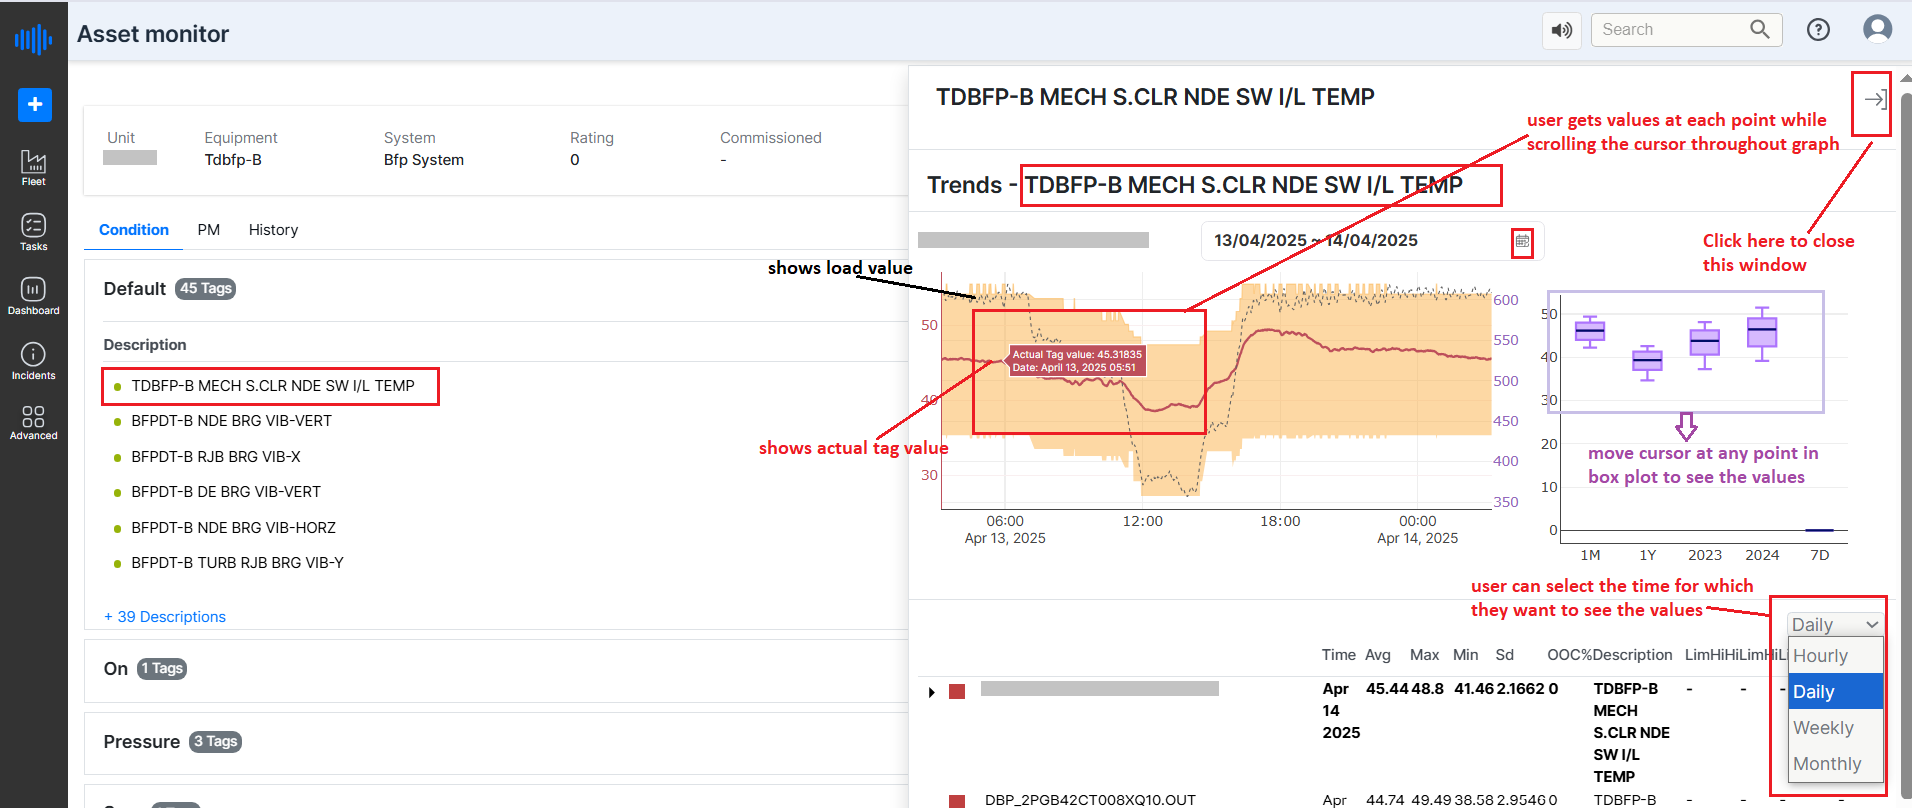
Figure 14. Graphial view of asset description
Temperature Monitoring Dashboard – TDBFP-B MECH S.CLR NDE SW I/L TEMP
Overview
This dashboard visualizes the Inlet Temperature (I/L TEMP) readings for the TDBFP-B mechanical system at the South Clear Non-Drive End (S.CLR NDE SW). It tracks temperature data across a selected time period (April 13–14, 2025) and provides historical trends, statistical analysis, and daily summaries to support operational monitoring, diagnostics, and predictive maintenance.
Key Features of the Dashboard
1. Time Series Graph (Left Panel)
- X-Axis: Timeline ranging from 06:00 on April 13, 2025, to 00:00 on April 14, 2025.
- Left Y-Axis (°C): Displays the temperature values (approximately 30°C to 55°C).
- Right Y-Axis (Secondary metric): Scales from 350 to 600 (likely for a correlated variable such as pressure or flow, shown with dashed lines and the shaded area).
Data Elements:
-
Solid Red Line: Represents the actual measured tag value.
-
Dashed Line with Shaded Orange Band: Indicates expected range or model-predicted behavior with tolerance.
-
Mouse Hover Tooltip: Shows the actual tag value (e.g., 45.3185°C at 05:51 on April 13, 2025) for quick insights.
-
Notable Observation: A distinct temperature dip around noon on April 13 followed by a rise towards the evening, peaking around 19:00.
2. Historical Box Plot (Right Panel)
- This section compares the current reading with historical trends over different time frames:
- 1 Month (1M)
- 1 Year (1Y)
- Calendar Years (2023, 2024)
- Last 7 Days (7D)
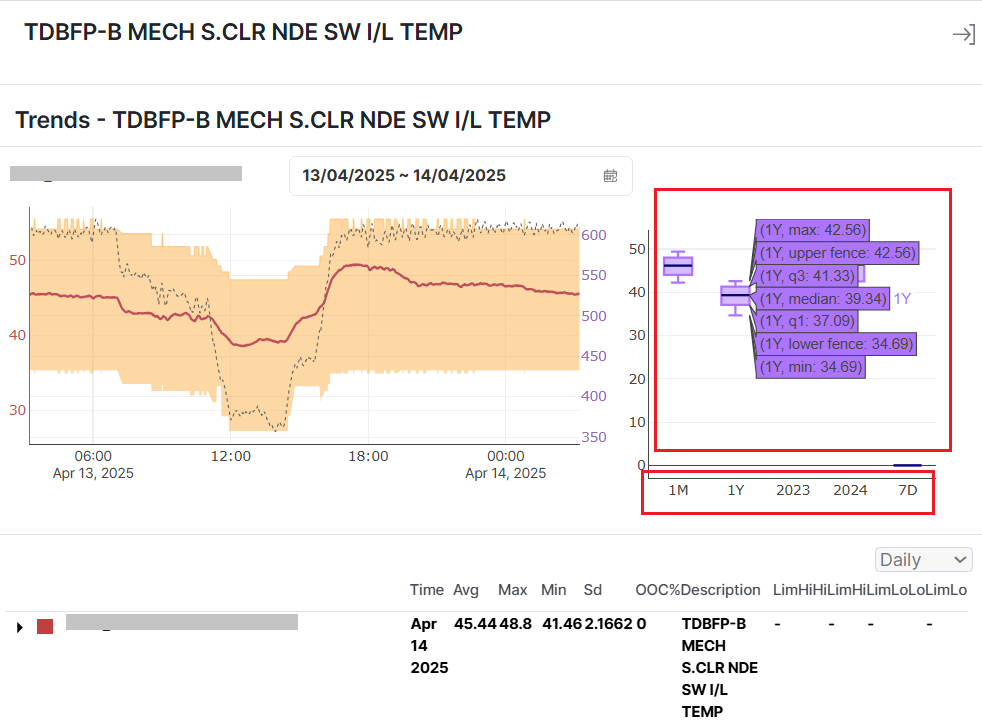
Figure 15. Plots and details
Box Plot Details:
-
Each box shows the median, interquartile range (Q1 to Q3), min, max, and outliers.
-
Example (1Y data):
- Max: 42.56°C
- Q3: 41.33°C
- Median: 39.34°C
- Q1: 37.09°C
- Min: 34.69°C
These values help detect outliers or abnormal shifts in the current temperature compared to historical behavior.
3. Daily Summary Table (Bottom Panel)
Provides a day-by-day summary of temperature statistics:
| Date | Avg (°C) | Max (°C) | Min (°C) | Std Dev | OOC% | Description |
| April 14 | 45.44 | 48.8 | 41.46 | 2.17 | 0% | TDBFP-B MECH S.CLR NDE SW I/L TEMP |
| April 13 | 44.74 | 49.49 | 38.58 | 2.95 | 0% | TDBFP-B MECH S.CLR NDE SW I/L TEMP |
OOC% (Out-of-Control Percentage): 0% on both days – indicates all values are within acceptable operational limits.
4. Time Granularity Selector (Bottom-Right)
- A drop-down menu allows users to toggle the data aggregation level:
-
Hourly
-
Daily
-
Weekly
-
Monthly
-
This feature provides flexibility in analysis, enabling users to switch from short-term monitoring to long-term performance evaluation.
This visual tool combines real-time monitoring, historical benchmarking, and daily statistics for effective temperature analysis of the TDBFP-B MECH system. It helps operators and maintenance teams:
-
Spot unusual behavior (e.g., temperature dips/spikes),
-
Compared to historical norms,
-
Detect trends for predictive maintenance,
-
Ensure operations remain within safety and performance thresholds.
The integrated dashboard ensures data-driven decisions that can improve reliability, optimize maintenance, and reduce operational risk.
Users can create a new Task from here as well.
The New task popup displays.
a. Enter a name for the task.
b. Select the assignee name from the drop-down list.
c. Select the due date of the task from the calendar.
d. If the task needs to be recurring, click the Make recurring link. The Recurring pattern pop-up displays.
e. Select the following:
- Frequency - Yearly, Monthly, Weekly, Daily, or Hourly.
- Starting on - Select the date and time.
- Interval in .. - shows the selected interval of recurrence based on the frequency and interval selected.
f. Click Recur to complete the action. g. Add a description of the task.
h. Click Add subtask(s) to include a subtask. Select the assignee name, due date, and time to complete the subtask. You can add several subtasks.
i. Click the Delete icon to delete the subtask.
j. Select the other details like Site, Unit, Team, Status of the task (Not started, In progress, Done, or Deferred), and Priority (High, Medium, and Low) from the respective drop-down lists.
k. Click Create a New Task. The Task is created and appears in the Upcoming Tasks tab of the selected team.
Note: How to create a new task has been already discussed in this document in detail also
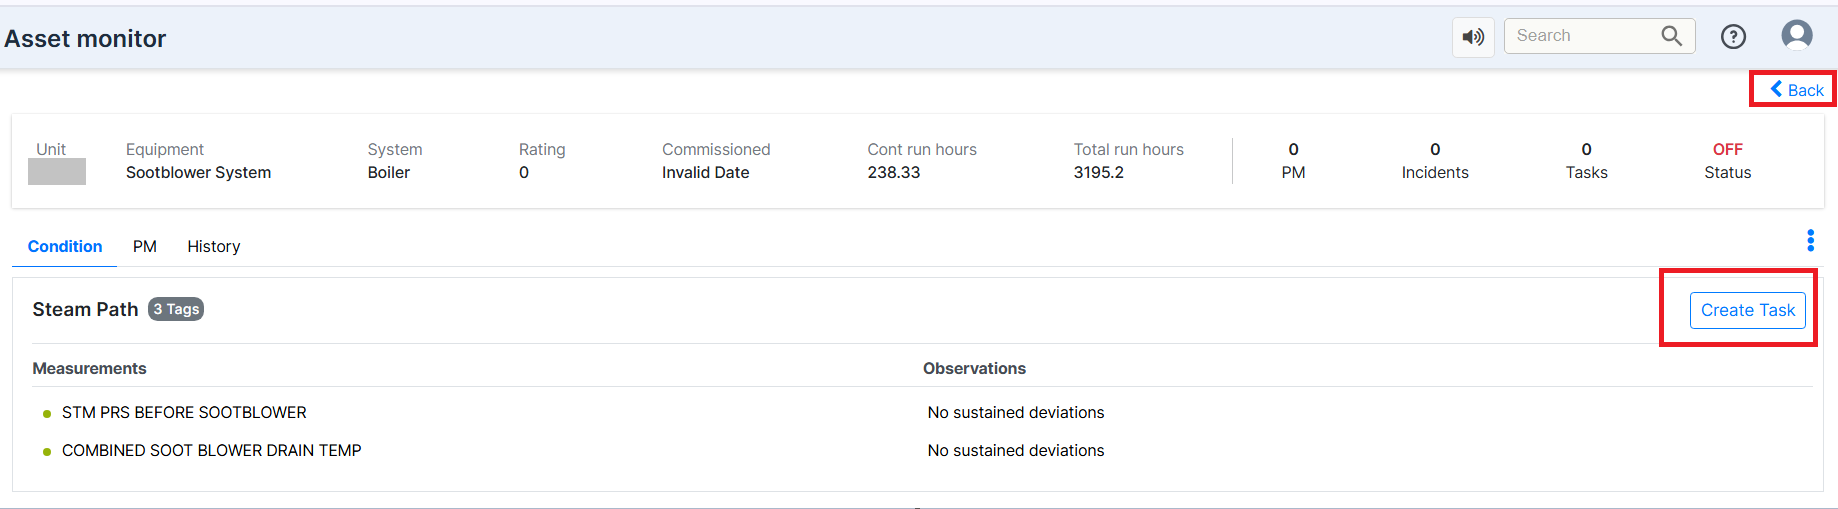
Figure 16. Create new task
To Edit the details of an asset user can click on three dots on the side and click on the Edit option here.
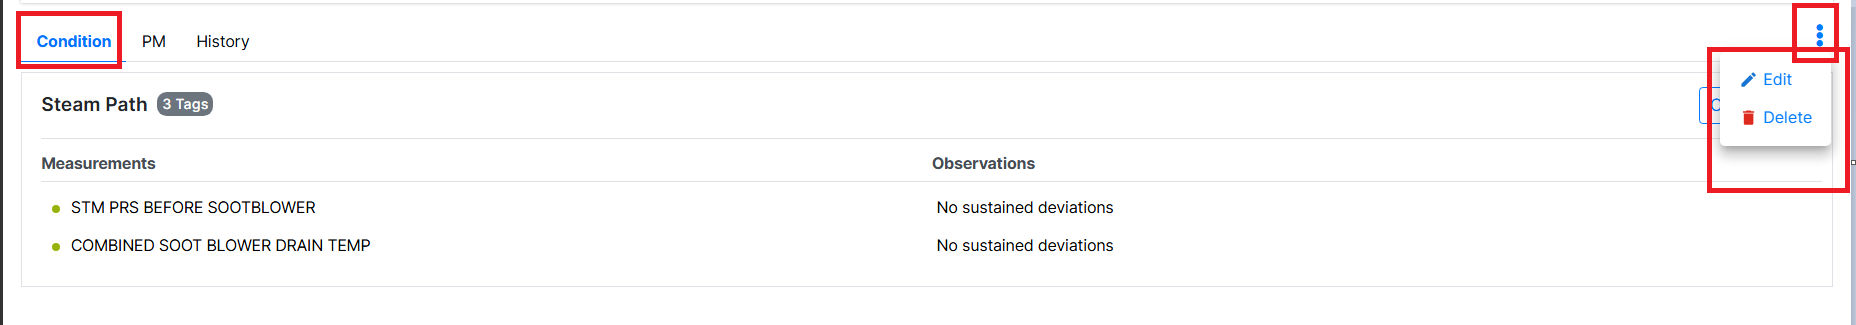
Figure 17. Condition and features
A new window will pop up. Fill in the details on that page and click on the Save option.
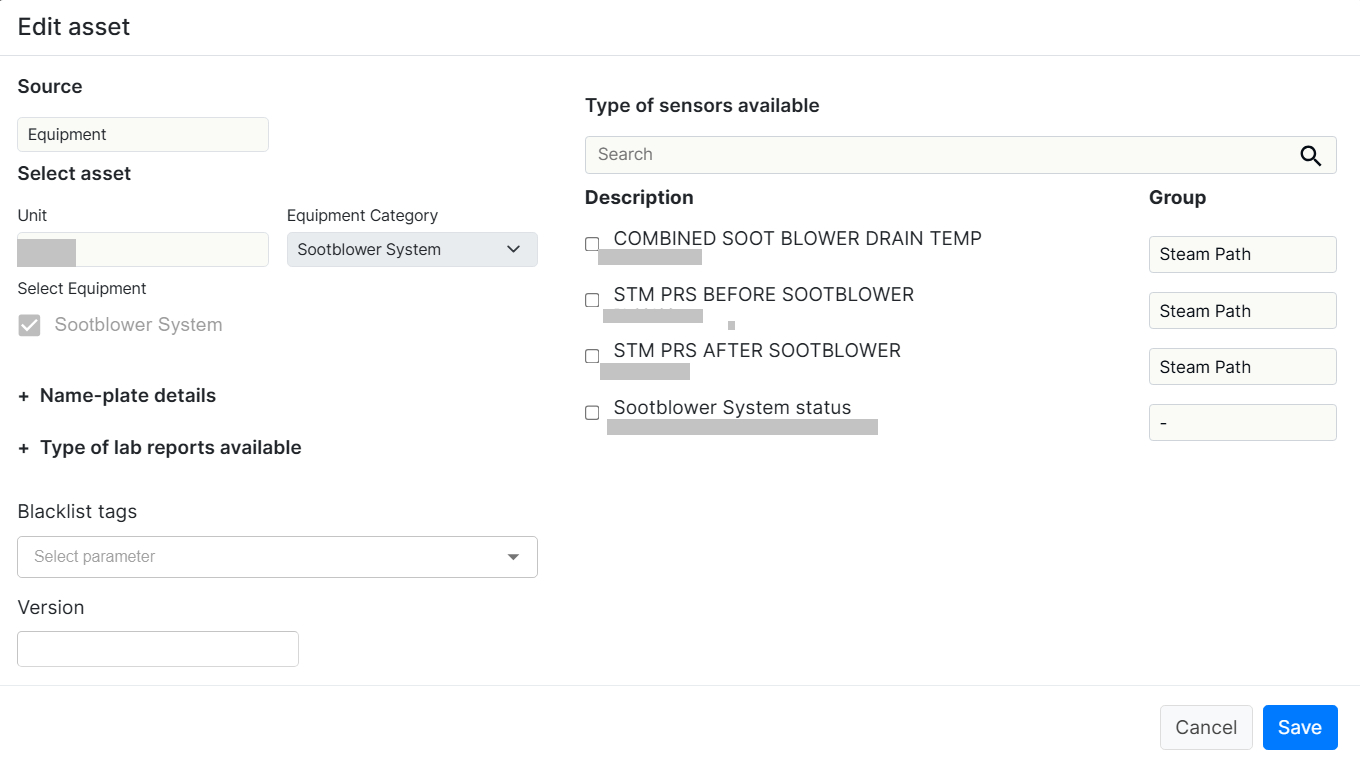
Figure 18. Edit Asset details
¶ 9. Preventive Maintenance Activities
Click the PM (preventive Maintenance) tab to view the past and upcoming PM activities. This feature allows users to Add a PM activity, edit or delete an upcoming one, or disable it if they feel the activity is not required to be initiated.
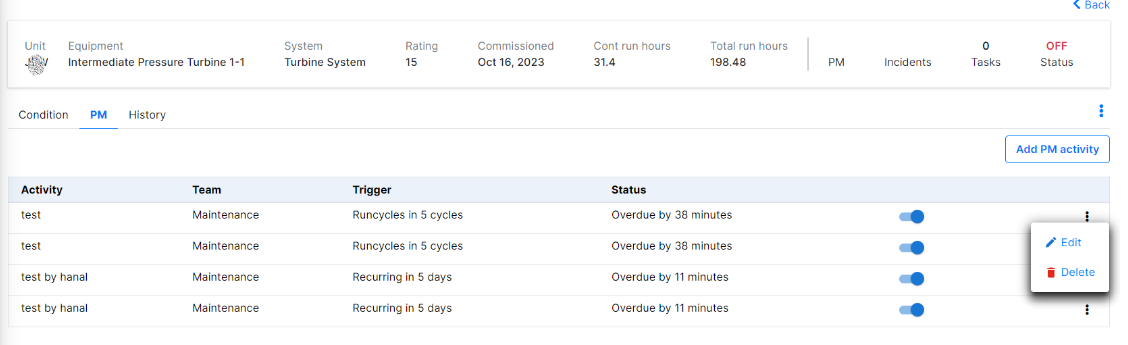
Figure 19. Preventive Maintenance Features
¶ 9.1 Adding New PM Activity
The output of a PM is the creation of a task and notifying the same to the team. To do this,
- Click Add PM activity. The Create PM Activity popup displays with the Equipment Name.
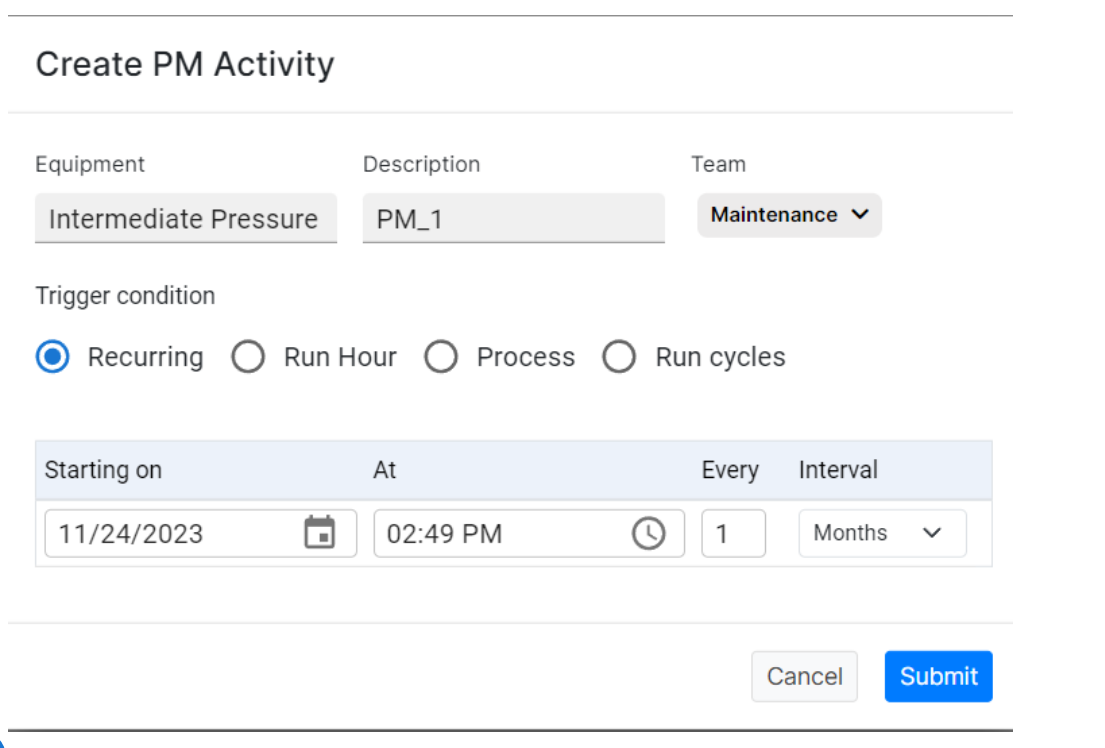
Figure 20. Create a new PM Activity
- Enter a brief description of the activity.
- Select the Team from the drop-down list.
- Select the Trigger Condition. The options are:
- Recurring - Select the Start Date and Time, enter the recurrence number, and select the interval - Hours, Days, Weeks, and Months.
- Run Hour - Select the Start Date and Time, and enter the Run-Hour number.
- Process - Select the Parameter and Condition from the drop-down lists, the Threshold number (upon reaching which the process will be triggered), enter the recurrence number and select the interval - Hours, Days, Weeks, and Months.
- Run Cycles - Select the Start Date and Time, and enter the Run-Cycle number.
- Click Submit. Based on the Trigger Conditions you have selected, the selected Team will be notified of a Task and displayed under Upcoming Tasks for the team.
¶ 10. Viewing the History of Incidents
The History tab displays a list of incidents that have occurred on the selected asset and also allows users to view the incident, make observations, and report failures.
- Click the row related to the incident you want to view. The Incident screen displays.
- Click Add Activity to Report a Failure. The Report Failure popup displays.