¶ Fleet Monitoring
Fleet tool can be used to monitor assets across the entire fleet of industrial assets and user-selected views of specific plants, asset classes, grouped by criticality of asset health.
More importantly, the team can then drill down into a specific asset of interest to look at the factors/components contributing to the poor health condition of the asset (for e.g. bearing, motor, lube oil system, etc) and further get a ready view of how those components have behaved in the short term as well as long term.
You get an overview of the incidents related to a particular unit over a period of time, say for the last one year. You also get the information about the severity of the incidents and whether they were accepted or rejected by the user. You get the update about an incident as late as the last shift in the plant. Incidents that were closed and those in progress.
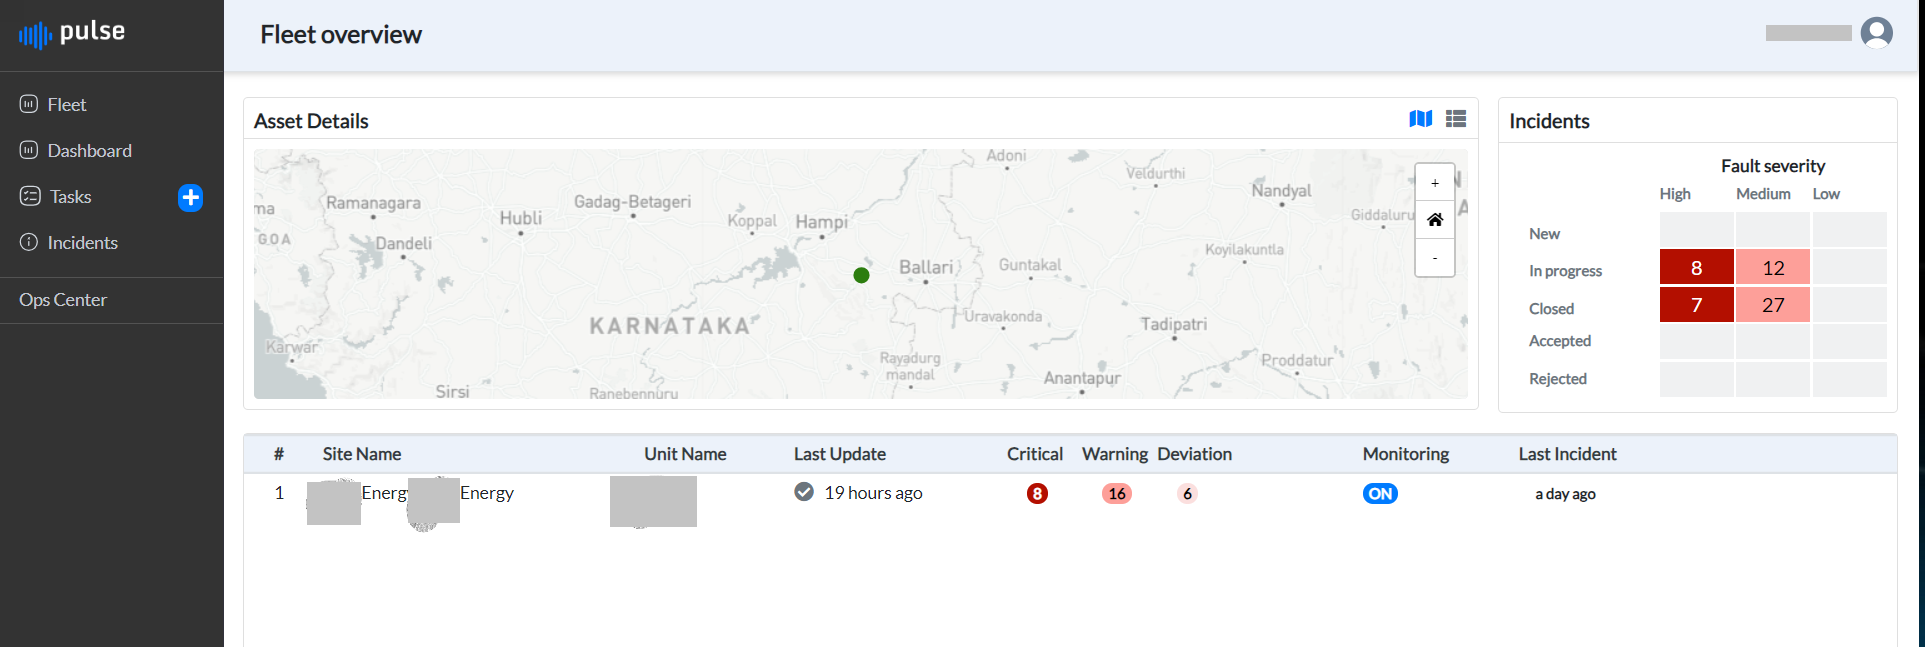
Figure 4. Fleet page
The Asset Details panel displays a map with the site location appearing as a green dot. If you hover the mouse over the green dot, the unit details are displayed.
The asset details are also shown in table form.
¶ Viewing Assets on Map
To view assets on a geographical map:
- Click the map icon on the right top of the Asset panel.
The assets (units) of a company appears as dots in different locations across
the globe as dots.
-
Click a dot on the map.
The asset details are displayed
¶ Zooming in and zooming out map view
The + and - icons on the right side of the map are for zooming in and zooming out the map view. Do the following:
- Click the + icon to expand the map view. With each click of + the map view increases in size.
In the default state of the map, the table showcases asset details for all units/sites. However, upon clicking the zoom-in button, only the asset details of units/sites associated with green dots on the map are displayed in the table.
Similarly the display of asset details in the table changes, for zoom out and zoom home buttons. - Click the - icon to contract the map view. With each click of - the map view decreases in size.
- Click the Home icon in the middle to restore the original view of the map.
¶ Viewing Asset Details in Tabular Format
To view the asset details in tabular format:
-
Click the Table icon,
The asset details are shown in a table.
Site and unit details with unit name appear as the first two columns of the table in the bottom panel.
-
Click the site name or unit name,
The dashboard corresponding to the unit is displayed.
Last update about the unit when received is the next column.
The next three columns show the incident criticality such as Critical, warning and Deviation. The number of incidents in each type are displayed with color coding.
-
Click the icon with a number under a particular incident severity
The Indients page for that severity opens.
The next column shows whether the unit is being monitored or not, that is whether the deviations and incidents along with the health of the equipment is being monitored. If the column shows ON, the parameters are being tracked. If the column value says OFF, the Pulse application does not receive the updates from the unit.
The last column in the bottom panel tells when the last incident occurred.
Incidents panel on the right hand side of the Fleet Overview page, displays the Incident matrix for Fault severity, up to the last 7 days. The number of incidents related to all the units are displayed here based on their severity levels - High, Medium, and Low.
The rows indicate the incident status:
-
New - indicates the incidents that have been opened in the last one shift that is in the last eight hours.
-
In progress - incidents that have been opened prior to 5 hours from now till the last 7 days.
-
Closed - incidents that have been closed in the last 7 days
-
Accepted by the user - incidents that have been open and are accepted by the user in the last 7 days
-
Rejected by the user - incidents that have been open and are rejected by the user in the last 7 day