¶ About Pulse
Pulse is an end-to-end predictive platform that connects Industrial Assets to its Workforce in real-time. Pulse is a platform that leverages Artificial Intelligence techniques to build domain specific solutions across industries.
To an end-user Pulse is an application that they consume via their mobile devices or from a web browser over the internet/intranet. The UI abstracts the complexity of a real-time application and focuses on creating value-added insights.
To an operator, Pulse is an assistant providing valuable insights and course correction guidance during the course of his/her shift helping them avoid oversight due to high workload and information deluge.
To a plant head or CEO, Pulse provides a standardized summary of the performance and reliability of their asset base. Highlighting problem areas early to help plan and coordinate an effective response. Most importantly, ensuring their plant runs in the safest manner and avoids catastrophic failure at any cost.
Pulse for Power: This represents a Thermal industrial assets specific solution which comes pre-built with models (Thermodynamics, Advanced Pattern recognition, Predictive Analytics, Fault Diagnostics) that evaluate the performance of an industrial asset and the health of individual assets to:
- Improve Reliability and ensure Safe operations of plant
- Help operate in the best configuration during Flexible operations
- Improve workforce productivity by digitizing data-related processes
Pulse comes with intuitive applications and tools for plant users to access insights generated from Predictive Models and take timely actions to help improve overall asset reliability. The focus has always been on building a robust communication backbone to ensure the right information reaches the right person at the right time.
In this section, we go into details of some of these tools as below:
¶ 1. Introduction
¶ 1.1 About Pulse
Pulse is an AI-powered Asset Reliability and Performance Management (ARPM) platform developed by ExactSpace Technologies to help industrial organizations continuously monitor the health, performance, and reliability of critical assets. The platform combines industrial data acquisition, engineering intelligence, predictive analytics, machine learning, and workflow automation to transform operational data into actionable maintenance insights.
Modern industrial facilities generate large volumes of operational data from Distributed Control Systems (DCS), Programmable Logic Controllers (PLC), Supervisory Control and Data Acquisition (SCADA) systems, historians, and field instrumentation. While this data is essential for plant operations, identifying early indicators of equipment degradation from thousands of continuously changing process variables remains a significant challenge.
Pulse addresses this challenge by continuously analyzing operational data, identifying abnormal equipment behavior, and presenting engineers with contextual information that supports timely and informed decision-making. Rather than relying solely on static alarm limits, the platform evaluates equipment behaviour using predictive models, engineering logic, and operational context to detect developing issues before they result in equipment failures or production losses.
By integrating condition monitoring, diagnostics, incident management, engineering analysis, and maintenance workflows into a single platform, Pulse enables organizations to move from reactive maintenance practices toward a predictive and reliability-centered maintenance strategy.
viewing-assets-on-map
¶ 1.2 Purpose of the Platform
The primary objective of Pulse is to improve plant reliability by enabling early detection of equipment degradation and providing engineering teams with the information required to take corrective action before failures occur.
The platform supports the complete reliability lifecycle---from acquiring operational data to generating predictive insights, identifying probable causes, assigning maintenance activities, and tracking engineering actions through to completion.
Pulse is designed to help organizations:
-
Improve equipment reliability and availability.
-
Reduce unplanned downtime.
-
Detect abnormal operating conditions at an early stage.
-
Support data-driven maintenance planning.
-
Improve collaboration between operations and maintenance teams.
-
Standardize reliability practices across multiple plants and production units.
These capabilities allow organizations to optimize maintenance resources, improve operational efficiency, and extend the service life of critical assets.
¶ 1.3 Intended Audience
Pulse is designed for different user groups across an industrial organization. While each role interacts with the platform differently, all users work within a common operational environment that promotes collaboration and shared visibility.
Operators use Pulse to monitor equipment health during routine plant operations. The platform provides visibility into asset conditions, alerts, and operational deviations, enabling operators to identify emerging issues before they escalate.
Reliability Engineers use Pulse as an engineering analysis platform to investigate equipment behaviour, review predictive diagnostics, validate abnormal operating conditions, and determine appropriate corrective actions.
Maintenance Engineers receive engineering tasks generated from predictive incidents, document inspection findings, update maintenance activities, and track task completion.
Plant Managers monitor the operational health of production units through dashboards, fleet summaries, and reliability indicators, enabling informed operational and maintenance decisions.
System Administrators configure assets, maintain metadata, manage users, deploy predictive models, and administer the platform.
¶ 1.4 Pulse Platform Overview
Pulse is built around a continuous reliability improvement workflow. Instead of treating monitoring, diagnostics, and maintenance as separate activities, the platform integrates these functions into a single operational process.
Operational data collected from industrial systems is continuously processed to identify abnormal equipment behaviour. When deviations are detected, the platform evaluates them using engineering logic and predictive analytics before generating incidents for engineering review. Verified issues can then be converted into maintenance tasks, ensuring that identified problems are tracked through to resolution.
This integrated workflow establishes a continuous feedback loop between plant operations, engineering analysis, and maintenance execution, enabling organizations to continuously improve equipment reliability.
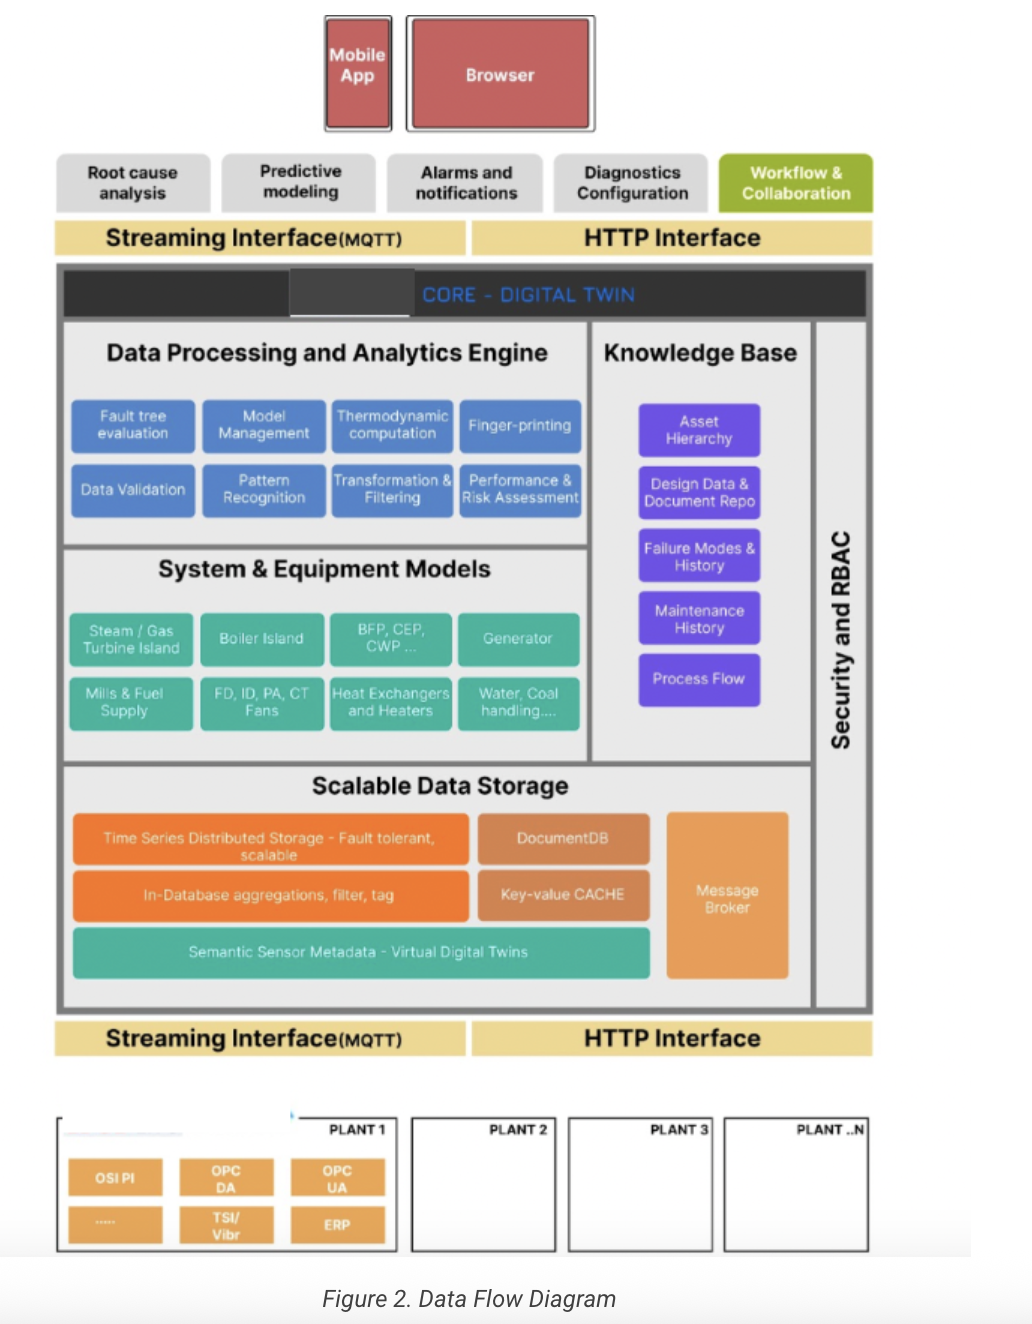
Figure 1. Pulse Reliability Workflow
¶ 1.5 Key Platform Capabilities
Pulse combines several engineering and analytical capabilities within a single platform.
Rather than operating as independent applications, these capabilities work together throughout the asset reliability lifecycle.
The platform provides:
-
Continuous asset condition monitoring.
-
Predictive anomaly detection.
-
Engineering fault diagnostics.
-
Incident lifecycle management.
-
Maintenance workflow automation.
-
Historical trend analysis.
-
Fleet-wide asset monitoring.
-
Equipment performance visualization.
-
Centralized engineering configuration.
-
Enterprise reporting and operational insights.
Each capability is explained in detail in the corresponding chapters of this manual.
¶ 2. Pulse Platform Architecture
¶ 2.1 Architecture Overview
Pulse follows a modular architecture designed to support large-scale industrial deployments while maintaining flexibility across different industries and operational environments. Each layer of the platform performs a specific function, from acquiring operational data to delivering predictive insights through the user interface.
The architecture separates data acquisition, analytics, engineering intelligence, application services, and presentation into independent components. This modular approach simplifies maintenance, improves scalability, and enables organizations to expand the platform as operational requirements evolve.
At a high level, Pulse consists of four major functional layers:
-
Industrial Data Sources -- Collects operational data from plant systems.
-
Pulse Analytics Platform -- Processes data using predictive analytics and engineering logic.
-
Business Applications -- Provides operational modules such as Dashboards, Incidents, Tasks, and Engineering Analytics.
-
User Access Layer -- Delivers information through web and mobile interfaces based on user roles.
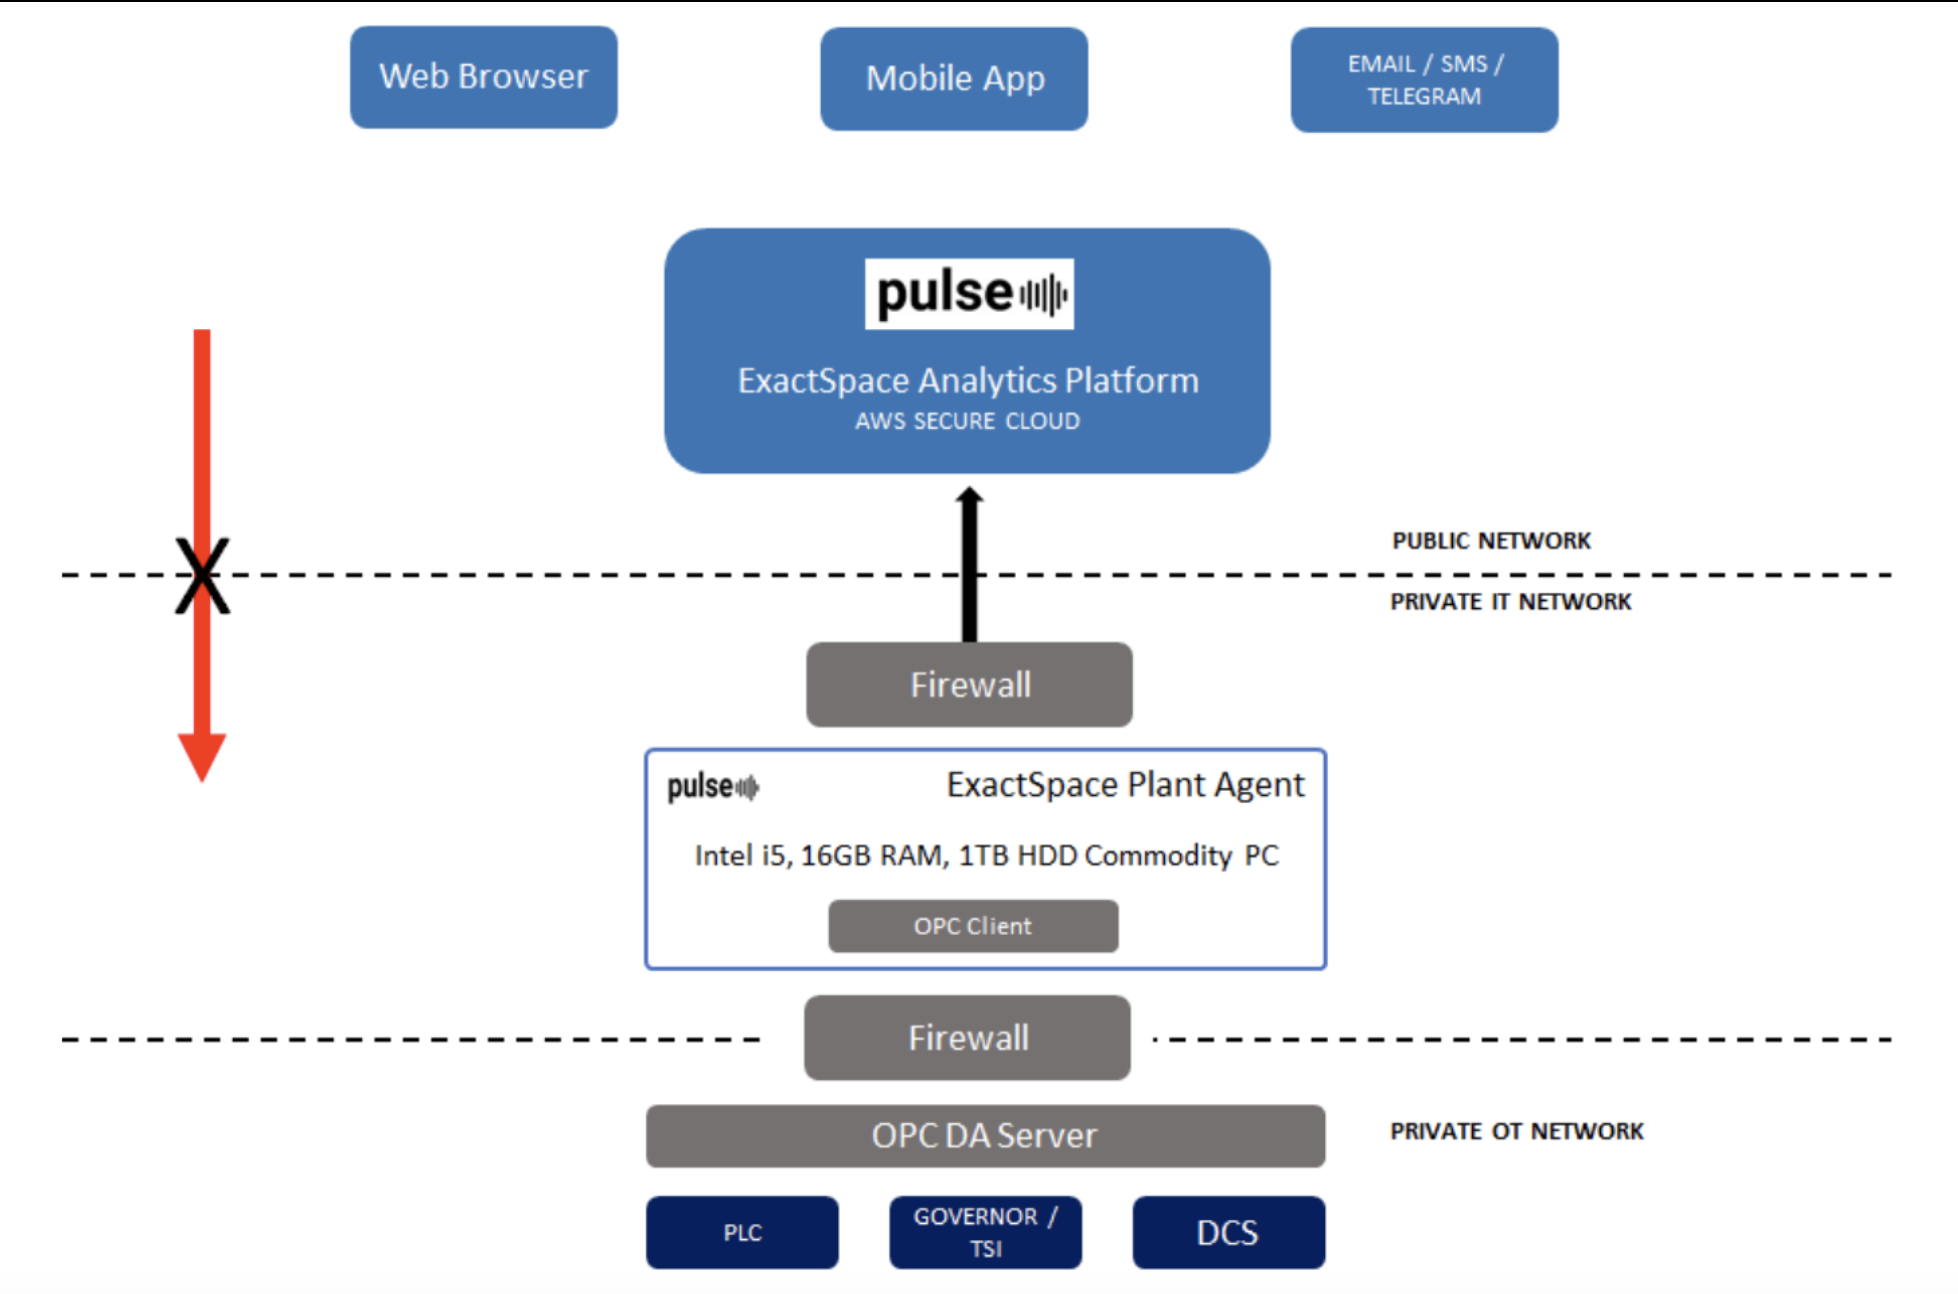
Figure 2. Pulse Platform Architecture
¶ 2.2 End-to-End Operational Workflow
The Pulse platform follows a continuous operational workflow that transforms raw industrial data into actionable engineering insights. Rather than functioning as independent monitoring or reporting tools, the various modules within Pulse work together as an integrated reliability ecosystem. Each stage in the workflow contributes to identifying equipment degradation, validating engineering conditions, initiating maintenance activities, and continuously improving plant reliability.
The workflow begins with data acquisition from industrial control systems and progresses through multiple stages of contextualization, predictive analysis, diagnostics, and engineering execution before ultimately feeding operational improvements back into the plant.
This integrated approach enables organizations to move beyond traditional alarm-based monitoring and adopt a proactive maintenance strategy driven by engineering intelligence.
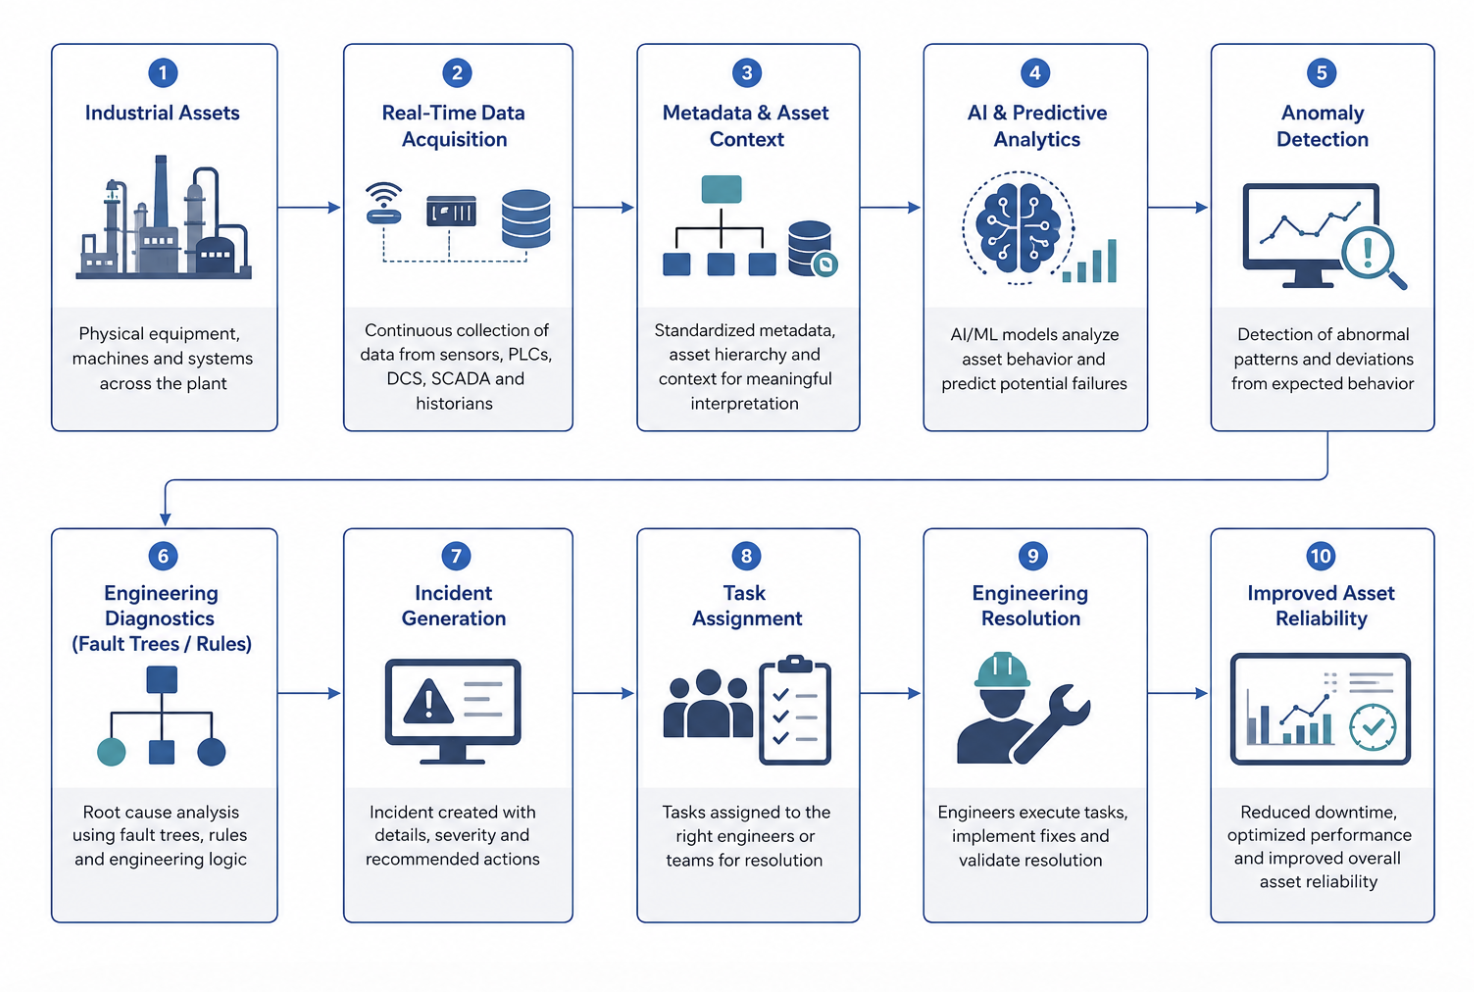
Figure 3. End-to-End Pulse Reliability Workflow
¶ 2.3 Industrial Data Acquisition
Every analytical function within Pulse begins with operational data collected from industrial assets. The platform is designed to integrate seamlessly with existing plant infrastructure and does not require modifications to the underlying control systems.
Operational data may originate from Distributed Control Systems (DCS), Supervisory Control and Data Acquisition (SCADA) systems, Programmable Logic Controllers (PLC), process historians, or other supported industrial data sources. These systems continuously transmit process measurements such as temperature, pressure, flow, vibration, speed, power consumption, valve positions, and equipment status to the Pulse platform.
Rather than storing data as isolated process values, Pulse associates every incoming signal with its corresponding equipment and engineering context. This relationship between sensor data and physical assets forms the foundation of all subsequent analysis.
Before data enters the analytics engine, it is validated for completeness, timestamp consistency, and engineering relevance. Invalid or incomplete records are identified during preprocessing to ensure that predictive models operate on reliable information.
¶ 2.4 Asset Context and Metadata
Raw process values alone provide limited engineering value unless they are associated with the equipment they represent. Pulse therefore enriches incoming operational data using a structured metadata framework that establishes the relationship between industrial assets, process systems, equipment, components, and measurement points.
Each sensor tag is mapped to its corresponding asset within the enterprise hierarchy. This contextual information enables Pulse to understand not only the current operating value but also the physical location, equipment type, process function, and engineering characteristics associated with that measurement.
For example, a temperature value of 78°C becomes significantly more meaningful when Pulse recognizes that it represents the drive-end bearing temperature of a centrifugal pump operating within a specific production unit. This contextual awareness allows predictive models and engineering diagnostics to evaluate measurements in relation to the equipment's intended operating conditions.
The metadata framework also supports standardized asset naming, equipment categorization, engineering properties, and operational relationships, ensuring consistency across multiple sites and deployments.
¶ 2.5 Predictive Analytics and Engineering Intelligence
Once operational data has been contextualized, it is continuously evaluated using the Pulse analytics engine. This engine combines machine learning techniques with engineering knowledge to identify abnormal operating behaviour that may indicate developing equipment problems.
Unlike conventional monitoring systems that depend solely on predefined alarm thresholds, Pulse evaluates multiple process variables simultaneously and considers their historical operating relationships. By learning how equipment behaves under normal operating conditions, the platform establishes adaptive performance boundaries that evolve with changing process conditions.
When live operating data begins to deviate from these expected patterns, Pulse identifies the abnormal behaviour and initiates further engineering analysis. This allows the platform to detect developing problems significantly earlier than traditional alarm-based approaches.
The predictive analytics engine works continuously in the background, automatically evaluating incoming operational data without requiring manual intervention from plant personnel.
¶ 2.6 Engineering Diagnostics
Detecting an abnormal operating condition represents only the first stage of the engineering investigation. Once an anomaly has been identified, Pulse applies engineering diagnostic logic to determine the probable cause of the observed behaviour.
The platform correlates information from multiple process variables, evaluates configured engineering rules, and applies fault tree logic to trace observed symptoms back to their most likely failure mechanisms. This process helps engineers distinguish between isolated sensor abnormalities and genuine equipment issues requiring maintenance attention.
By presenting supporting evidence alongside diagnostic conclusions, Pulse enables engineering teams to validate findings before initiating corrective action. This reduces unnecessary maintenance activities while improving confidence in predictive recommendations.
The diagnostic results generated during this stage become part of the incident record and remain available throughout the maintenance lifecycle.
¶ 2.7 Incident and Workflow Generation
When engineering analysis confirms that an abnormal operating condition requires attention, Pulse automatically generates an incident. The incident serves as the central record for documenting the detected condition, supporting engineering evidence, diagnostic results, and subsequent maintenance activities.
Rather than creating multiple independent alarms for related process deviations, Pulse groups associated observations into a single engineering event. This approach reduces alarm fatigue and provides maintenance teams with a consolidated understanding of the issue.
Each incident may subsequently be assigned to engineering personnel, converted into a maintenance task, or linked to existing work activities depending on the organization's maintenance workflow. Throughout this process, Pulse maintains complete traceability between the original predictive observation, engineering investigation, and corrective action.
This closed-loop workflow ensures that predictive insights result in measurable operational improvements rather than remaining isolated analytical observations.
¶ 3. Getting Started with Pulse
¶ 3.1 Introduction
Pulse is accessed through a secure web-based interface that provides users with a unified environment for monitoring plant performance, investigating equipment behaviour, and managing engineering activities. The platform is designed to present information relevant to the user's responsibilities while maintaining a consistent navigation experience across all functional modules.
Following successful authentication, users are presented with the Operations Centre, which serves as the primary workspace for day-to-day interaction with the platform. From this central location, users can navigate to operational dashboards, engineering analysis tools, incident management, task tracking, configuration modules, and reporting functions.
Although the available modules may vary depending on user permissions, the overall navigation structure remains consistent throughout the application.
¶ 3.2 User Authentication
Access to Pulse is controlled through authenticated user accounts. Each user is assigned credentials by the system administrator and granted permissions based on their organizational role and responsibilities.
To access the application, users enter their assigned username and password on the Pulse login page. After successful authentication, the platform validates the user's access rights and loads the appropriate operational environment.
If incorrect credentials are entered, Pulse displays an authentication error and prompts the user to retry. Repeated unsuccessful login attempts may be subject to security policies configured by the organization.
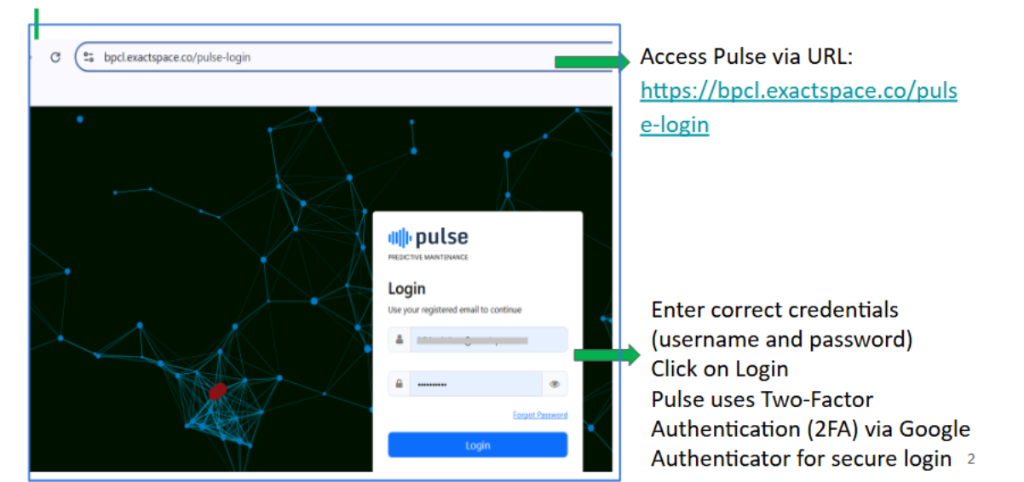
Figure 4. Pulse Login Process
¶ 3.3 Landing Page
After a successful login, the Task page opens by default. This page serves as the user's starting point for working within the Pulse platform.
The Task page gives users immediate visibility into ongoing engineering activities and maintenance work that requires attention. Instead of navigating through multiple modules to understand pending work, users can directly view active tasks, recently assigned activities, upcoming schedules, and completed actions from a single location.
From here, users can move to other modules using the navigation menu available on the left side of the application.
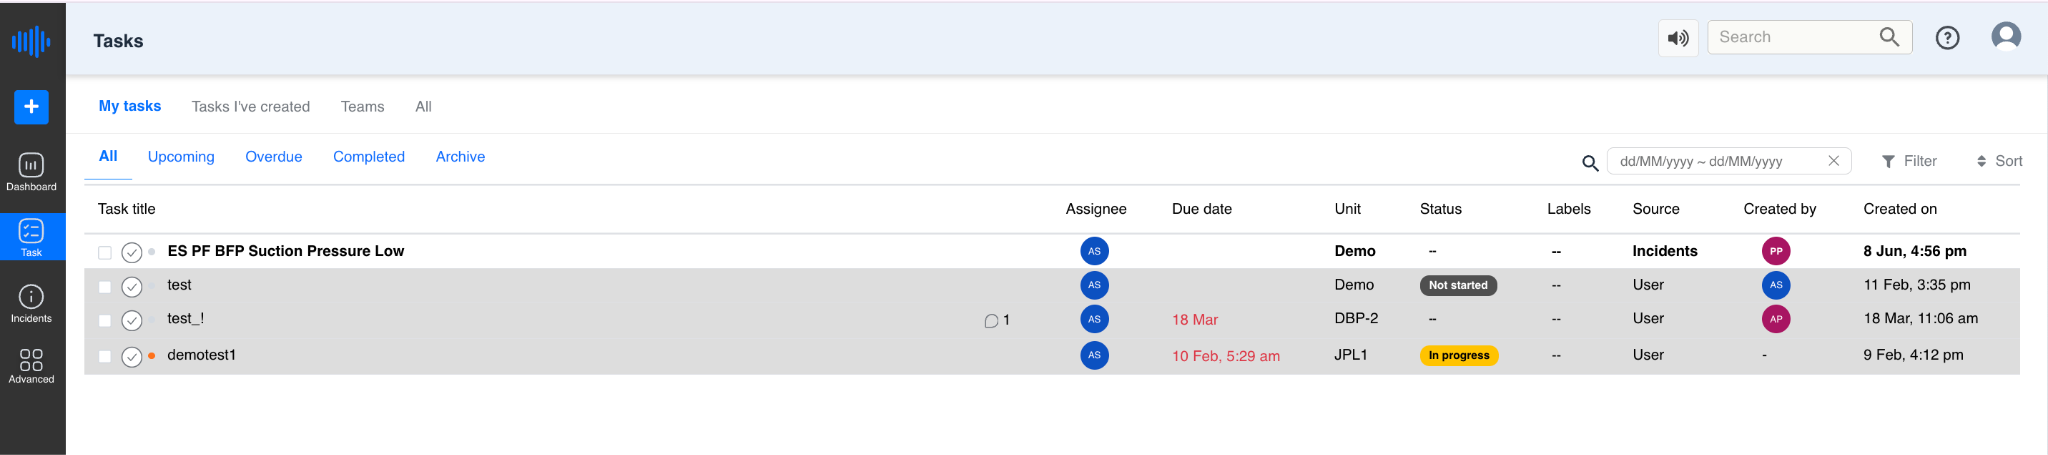
Figure 4. Pulse Landing Page
¶ 3.4 Navigation Panel
The navigation panel is available on the left side of every page and provides quick access to the main modules of the Pulse platform. The navigation remains consistent throughout the application, allowing users to switch between different modules without changing the overall interface.
Depending on the permissions assigned to the logged-in user, additional modules and configuration pages may be available.
The navigation panel provides access to modules such as:
-
Tasks
-
Dashboard
-
Incidents
-
Advanced
Additional modules can be accessed through the Advanced section.
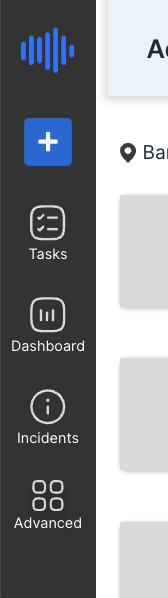
Figure 5. Navigation Panel
Creating New Records
The + (Plus) button available in the navigation panel provides quick access to commonly used creation functions.
Clicking the + icon displays a shortcut menu from which users can create new records without navigating to the respective module.
Depending on the configured permissions, the following options are available:
-
Task -- Create a new task and assign it to a user or team.
-
Asset -- Add a new asset to the system.
-
Failure Report -- Record a new equipment failure for further investigation and tracking.
This shortcut helps users perform frequently used actions quickly, improving day-to-day usability.
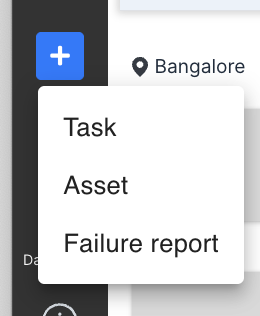
Figure 7. Quick Create Menu
¶ 3.5 Advanced Module
The Advanced section provides access to engineering, administration, configuration, and analysis modules available within Pulse.
To open the Advanced page, click the Advanced icon from the navigation panel. The application opens a dashboard containing all available modules that the logged-in user is authorized to access.
The Advanced page serves as a central entry point for configuration, engineering analysis, reporting, and system administration. Instead of displaying every module directly in the navigation panel, Pulse groups these features under the Advanced section to keep the interface organized.
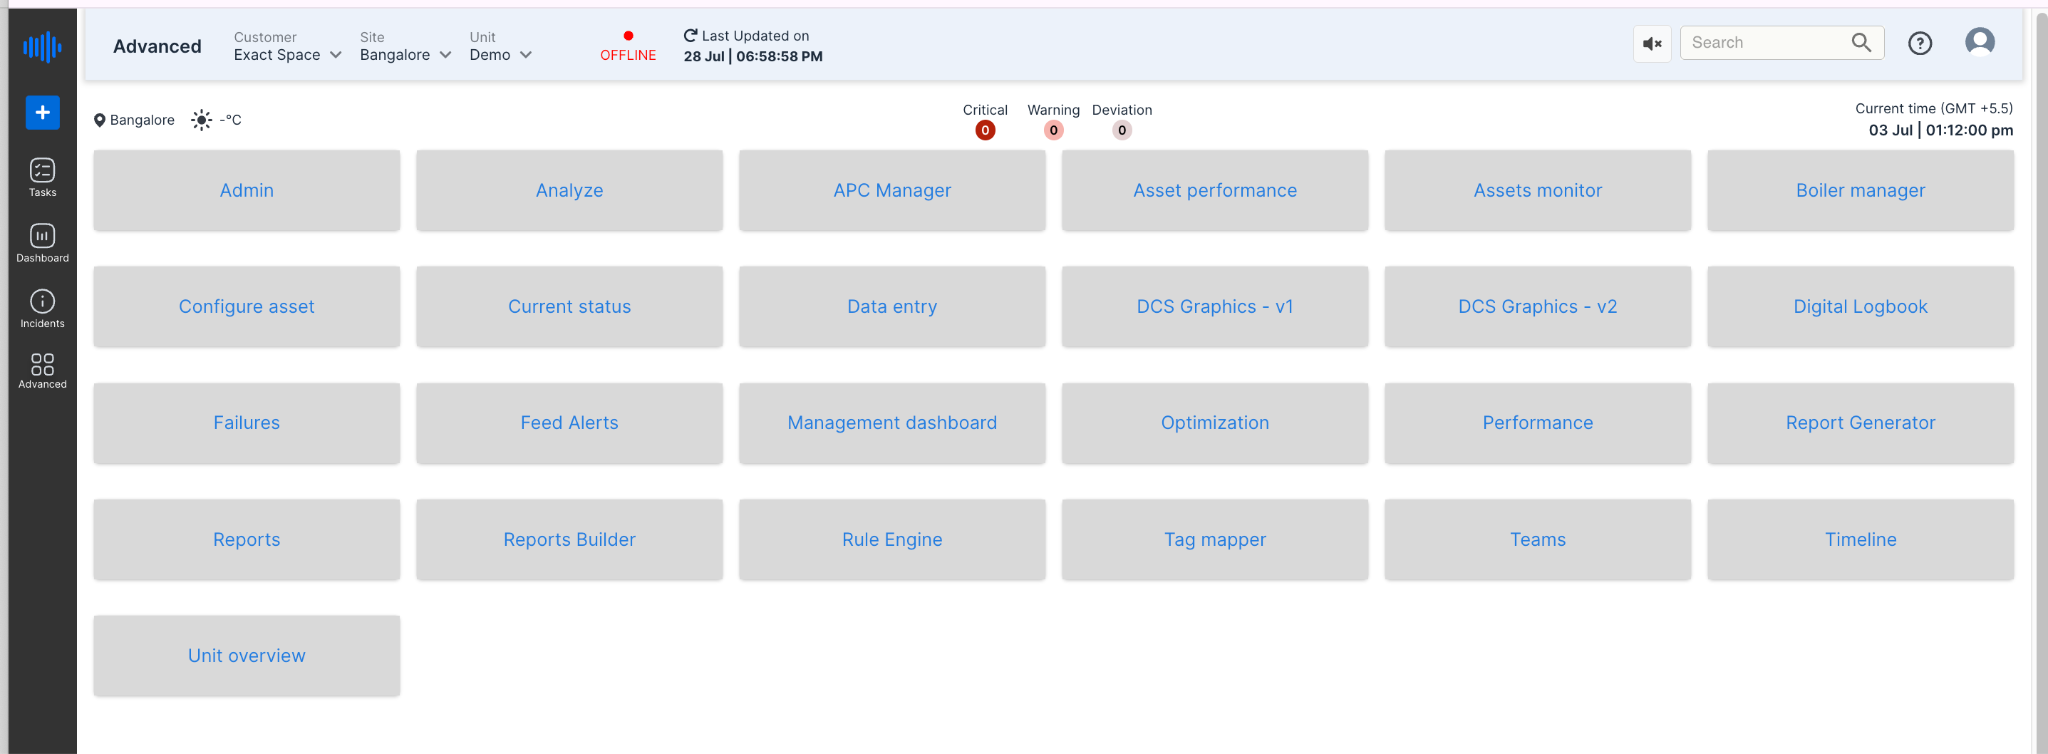
Figure 6. Advanced Module
The Advanced page includes modules such as:
| Module | Description |
|---|---|
| Admin | Manage application settings and administrative functions. |
| Analyze | Perform detailed engineering and historical data analysis. |
| APC Manager | Configure and manage Advanced Process Control functions. |
| Asset Performance | Monitor equipment performance and operational behaviour. |
| Assets Monitor | View the health and status of configured assets. |
| Boiler Manager | Access boiler-specific monitoring and analysis features. |
| Configure Asset | Configure assets and related engineering information. |
| Current Status | View the current operating status of plant equipment. |
| Data Entry | Enter operational or engineering data manually where required. |
| DCS Graphics | View process graphics integrated with the control system. |
| Digital Logbook | Record operational events, observations, and shift information. |
¶ 3.6 User Permissions
Pulse uses Role-Based Access Control (RBAC) to manage access to different modules and features.
Each user account is assigned one or more roles by the system administrator. These roles determine which modules the user can access and what actions they are allowed to perform.
For example, an administrator may have access to configuration modules, user management, asset setup, and system settings, while an engineer may be allowed to analyse equipment performance, investigate incidents, and update maintenance tasks.
Although the navigation structure remains the same for all users, the features available within each module depend on the permissions assigned to the user account.
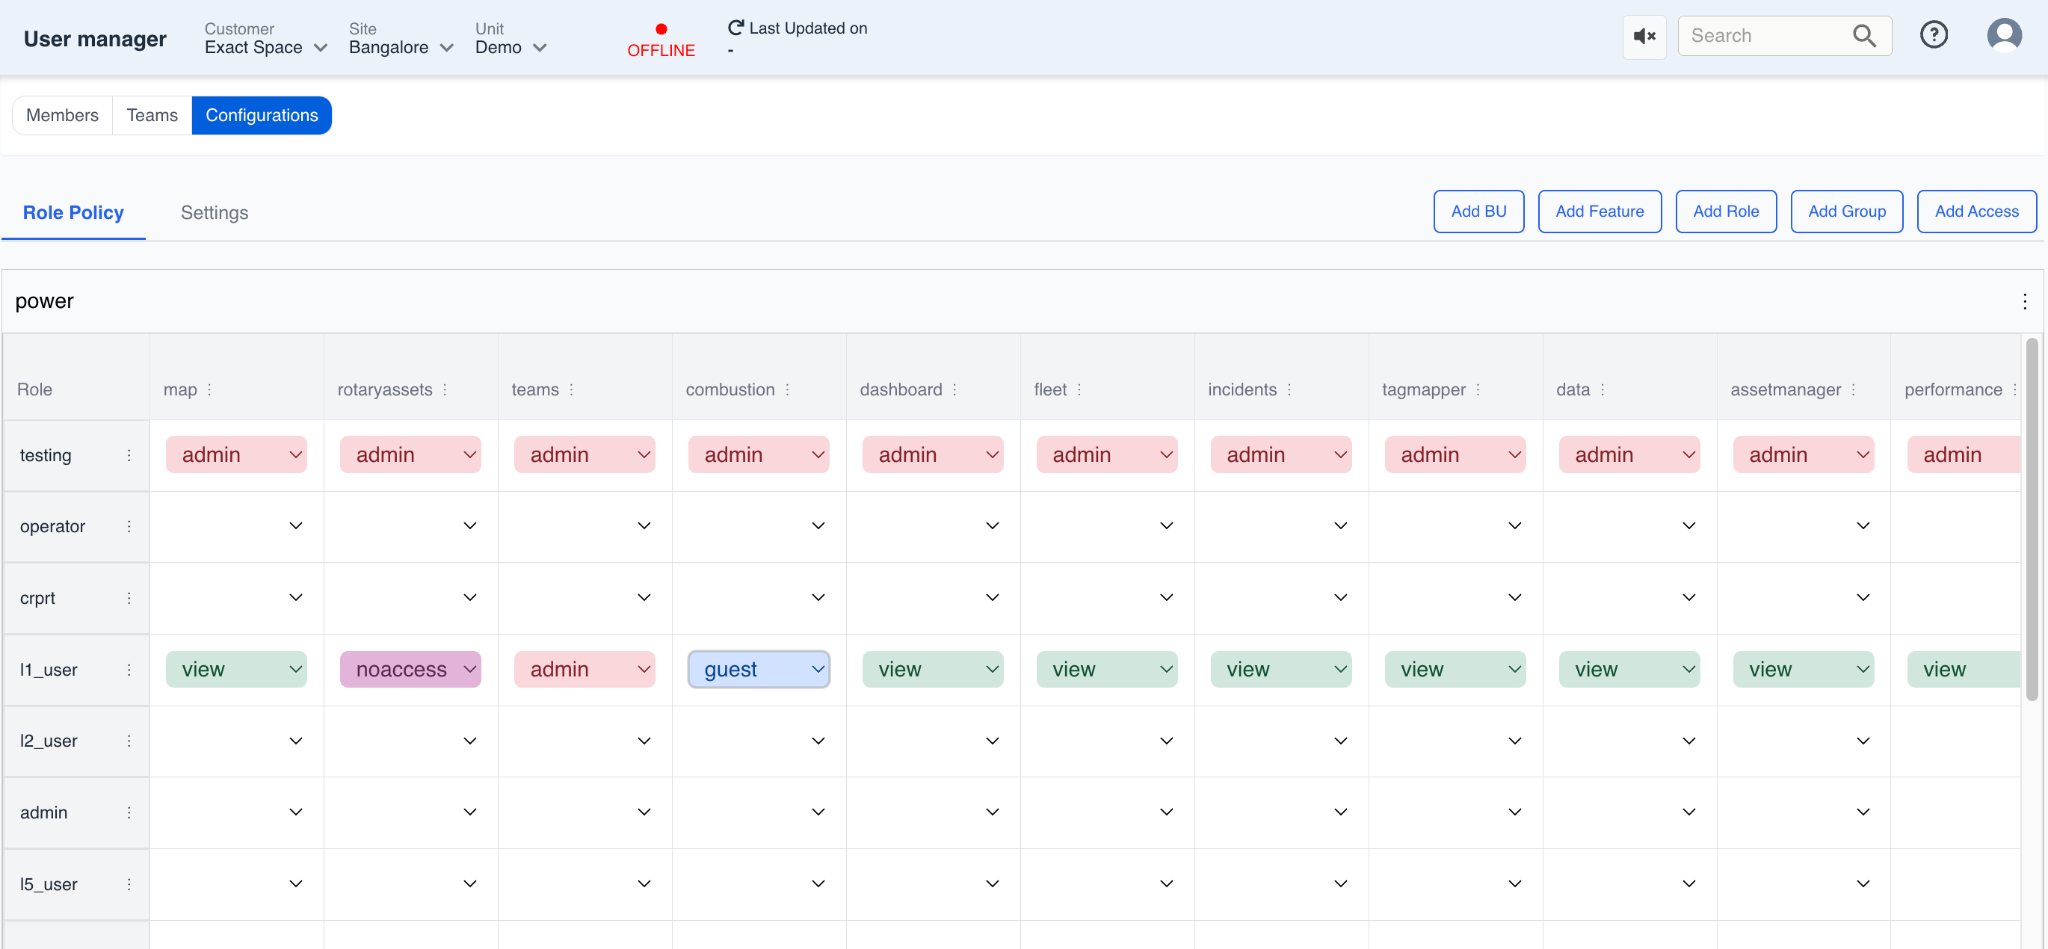
Figure 7. User Manager- Access Information
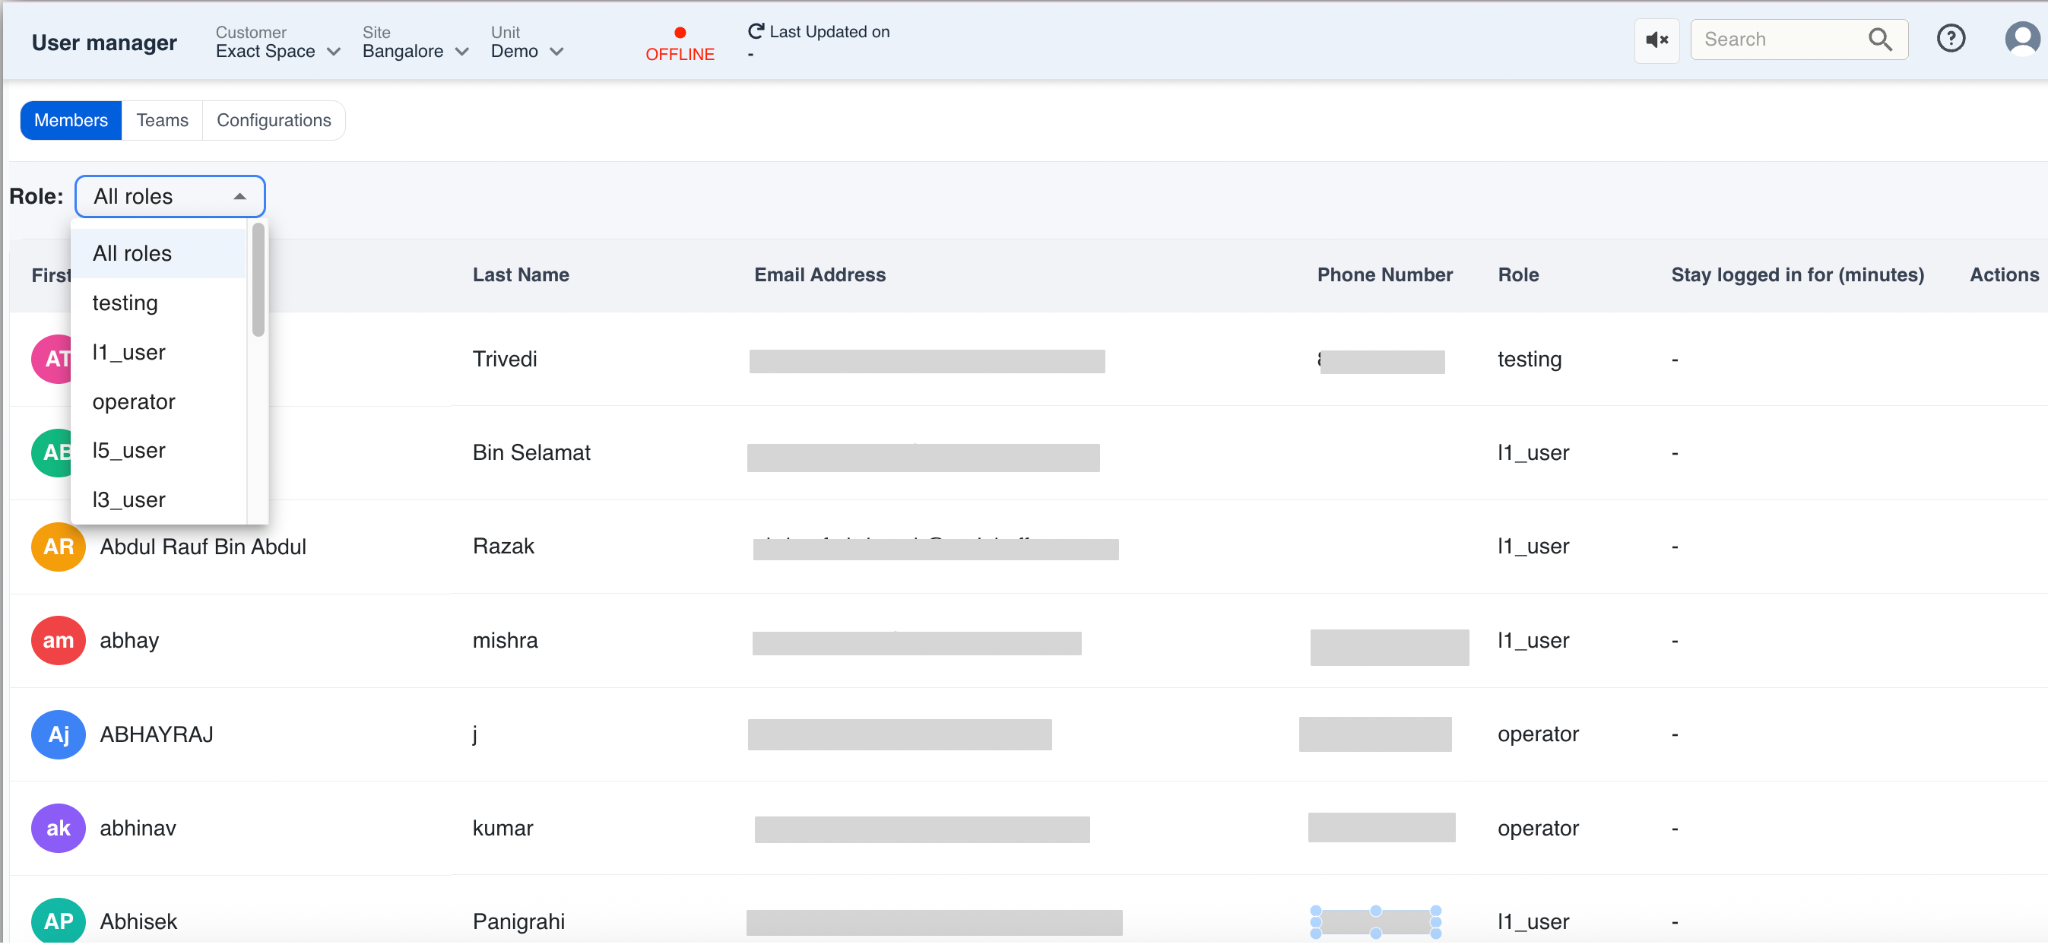
Figure 8. User Manager- Members information
¶ 4. Dashboard
The Dashboard is the primary monitoring page of Pulse. It provides a consolidated view of the selected unit by displaying the current operational status, equipment health, active incidents, and task summary in a single screen.
The Dashboard enables users to monitor the overall health of the plant without navigating through multiple modules. From this page, users can quickly identify abnormal operating conditions and navigate to the relevant module for detailed analysis.
The information displayed on the Dashboard is refreshed periodically based on the latest data received from the connected plant systems. This enables operators and engineers to identify abnormal operating conditions quickly and move directly to the relevant module for further analysis.
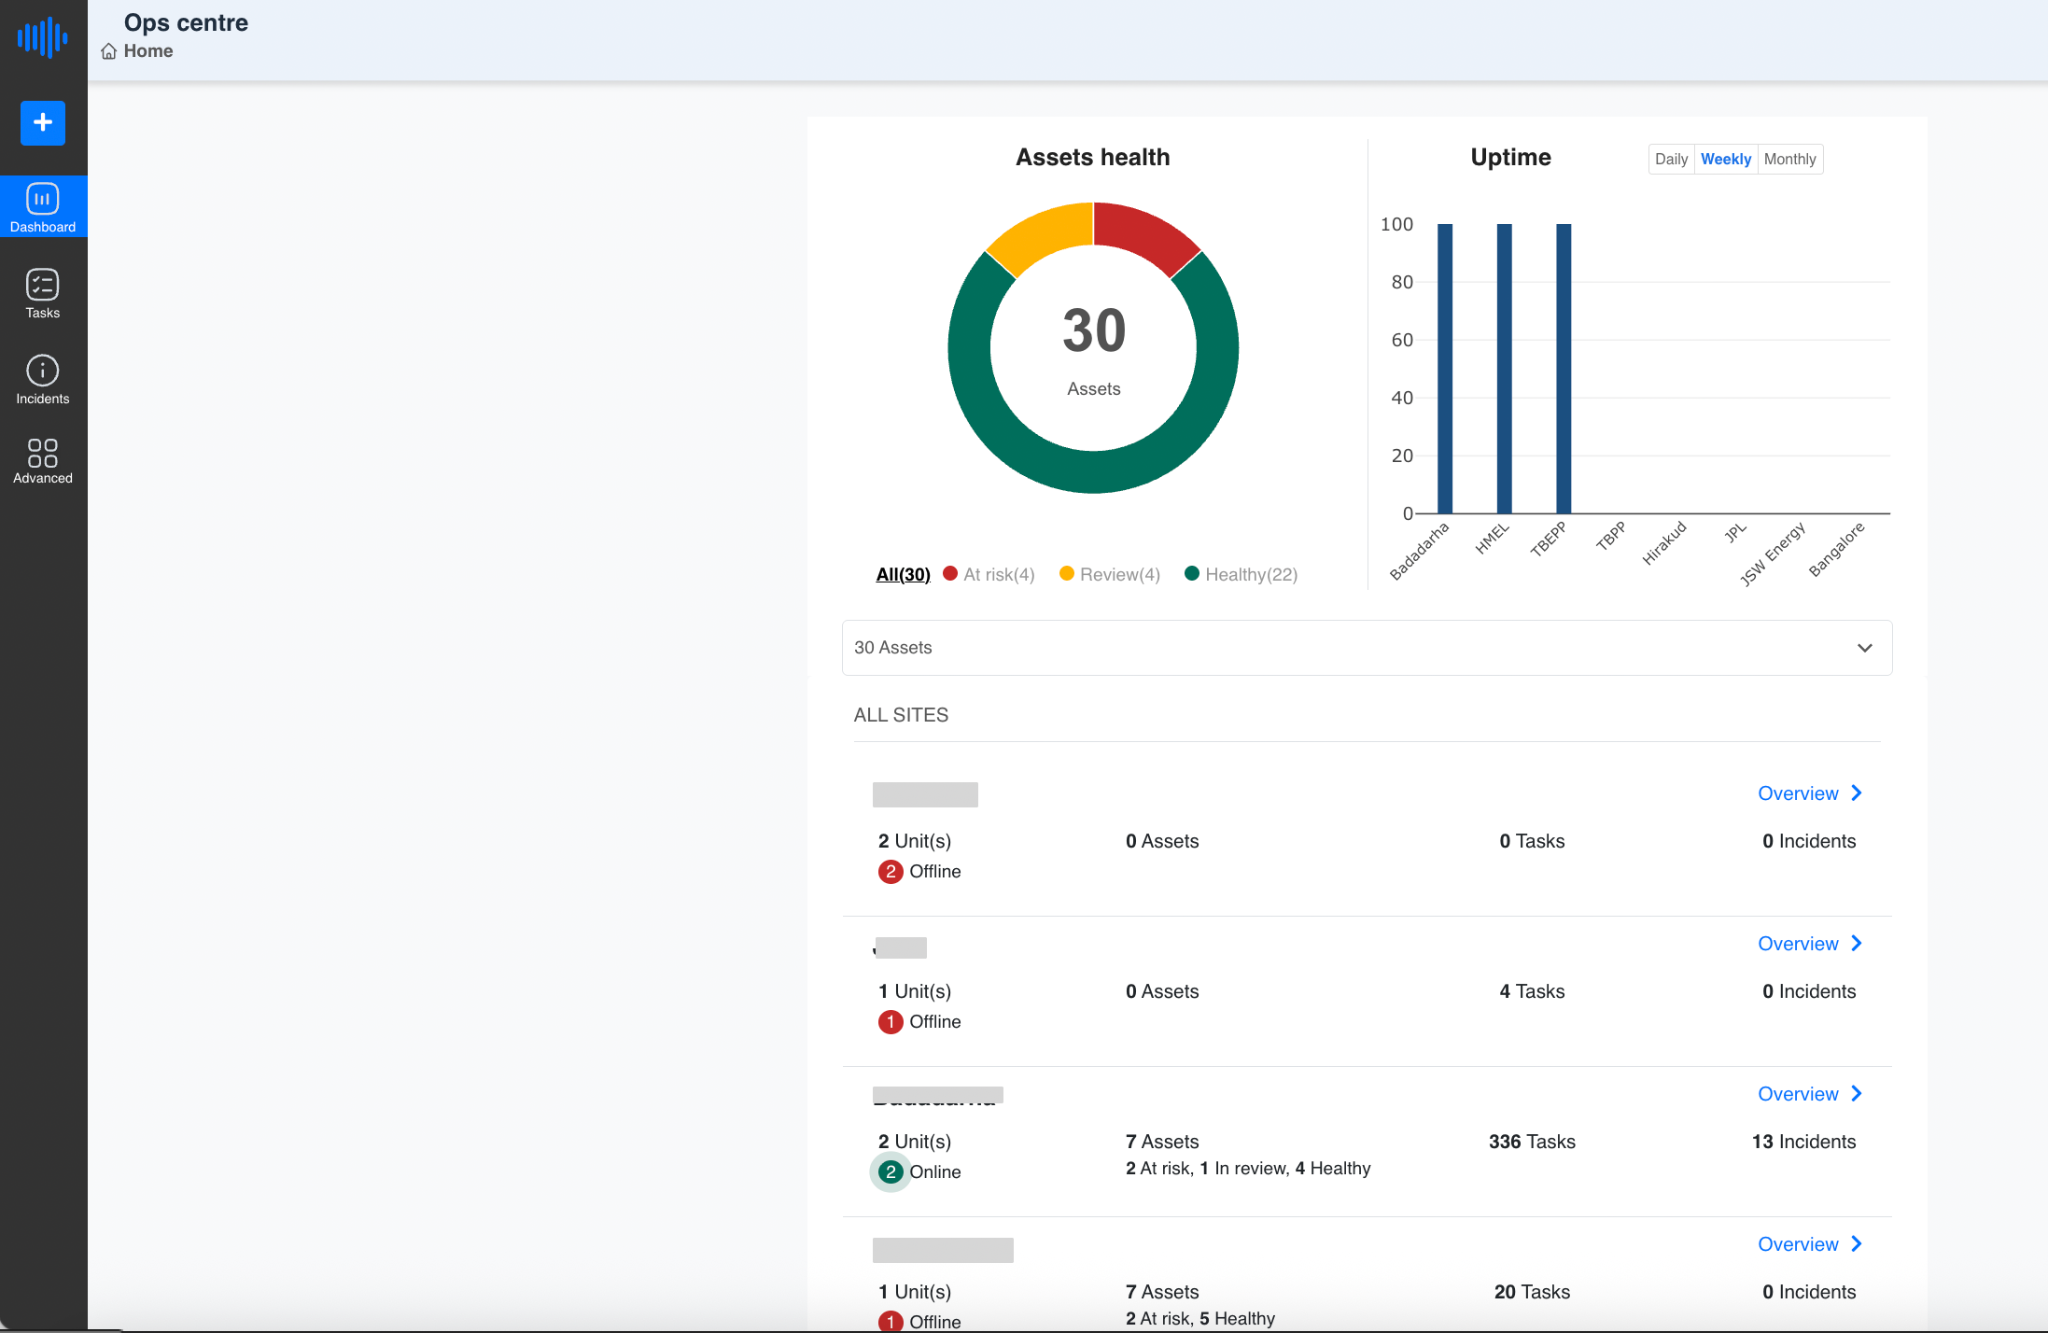
Figure 9. Pulse Dashboard
¶ 4.1 Dashboard Overview
When the Dashboard is opened, the Operations Centre is displayed for the selected unit.
The page is divided into multiple sections, each providing a summary of a specific area of plant operation.
The Dashboard includes:
-
KPI Status -- Displays the total number of monitored KPIs along with the count of Healthy and Unhealthy KPIs.
-
Incidents -- Displays the total number of active incidents categorized as Critical, Warning, and Deviation. Recent incidents are listed below the summary along with the affected asset and current measured value.
-
Task Summary -- Displays the total number of tasks and their current status, such as Completed, In Progress, and Not Started.
-
Unit-wise KPI Status -- Provides a visual representation of KPI health across the selected unit, allowing users to quickly identify equipment that requires attention.
Each section on the Dashboard provides a high-level summary. Users can open the corresponding module to view detailed information.
¶ 4.2 Navigating from the Dashboard
The Dashboard acts as the starting point for monitoring day-to-day plant operations. From this page, users can directly open other Pulse modules to investigate alarms, review equipment performance, or manage maintenance activities.
The navigation flow is shown below.
- Dashboard → Incidents
The Incidents panel displays the number of active incidents detected by Pulse. Incidents are grouped based on their severity as Critical, Warning, or Deviation.
Selecting an incident opens the Incident module, where users can review complete diagnostic information, affected assets, engineering comments, historical trends, and recommended actions.
This allows engineers to investigate abnormal operating conditions without manually searching for the affected equipment.
{width="3.5693602362204726in"
height="3.6718755468066493in"}
Figure 10. Dashboard Navigation to Incidents
- Dashboard → Asset Monitor
The Dashboard also provides direct access to the Asset Monitor.
Selecting an asset opens the Asset Monitor page for the selected equipment. Users can review the operational condition of the asset, analyse process parameters, view historical trends, and perform detailed engineering analysis.
This enables engineers to move from a plant-level overview to equipment-level analysis in a few clicks.
{width="3.8509547244094486in"
height="3.9739588801399823in"}
Figure 11. Dashboard Navigation to Asset Monitor
- Dashboard → Tasks
The Task Summary section provides an overview of all maintenance and operational tasks created within Pulse.
Selecting a task opens the Task module, where users can review task details, assigned personnel, current status, due dates, and progress.
Tasks created from incidents remain linked to their originating incident, allowing engineers to track the complete workflow from anomaly detection through resolution.
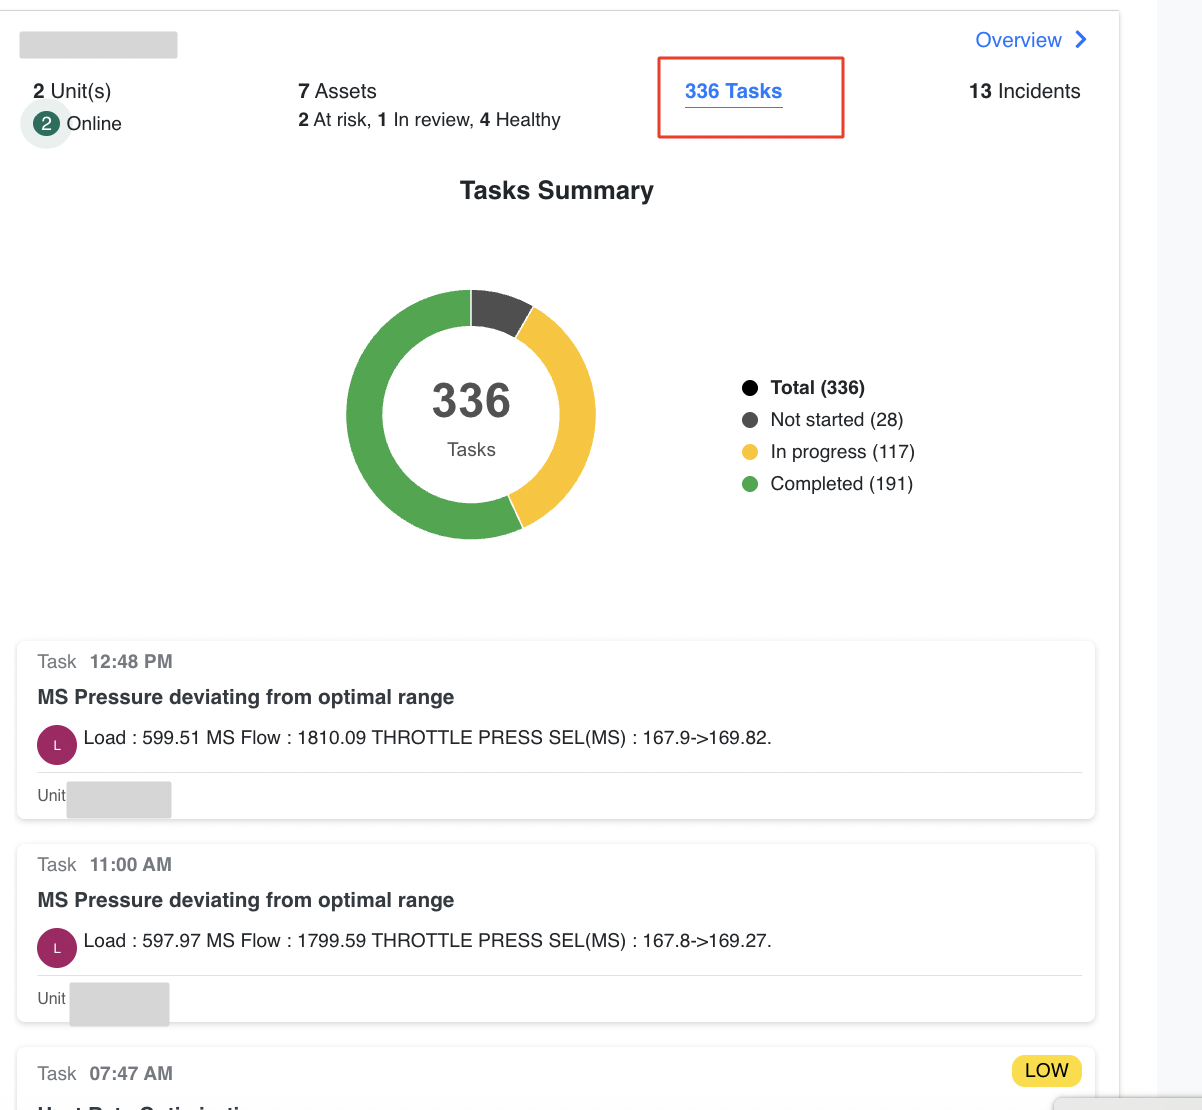
Figure 12. Dashboard Navigation to Task
This allows users to move from a high-level operational overview to detailed engineering analysis with minimal navigation.
¶ 5. Ops Centre
The Ops Centre is the primary monitoring workspace in Pulse. It provides a centralized view of the selected unit, allowing users to monitor equipment health, review incidents, track maintenance activities, and analyse process performance from a single location.
After selecting Overview for a unit from the Dashboard, the Operations Centre opens. The selected unit remains active throughout the session, ensuring that all information displayed relates only to that unit.
The Operations Centre is organized into three main tabs:
-
Unit Overview
-
Timeline
-
Dashboards
Each tab provides a different perspective of the same unit, allowing users to switch between summary information, event history, and engineering dashboards without leaving the workspace.
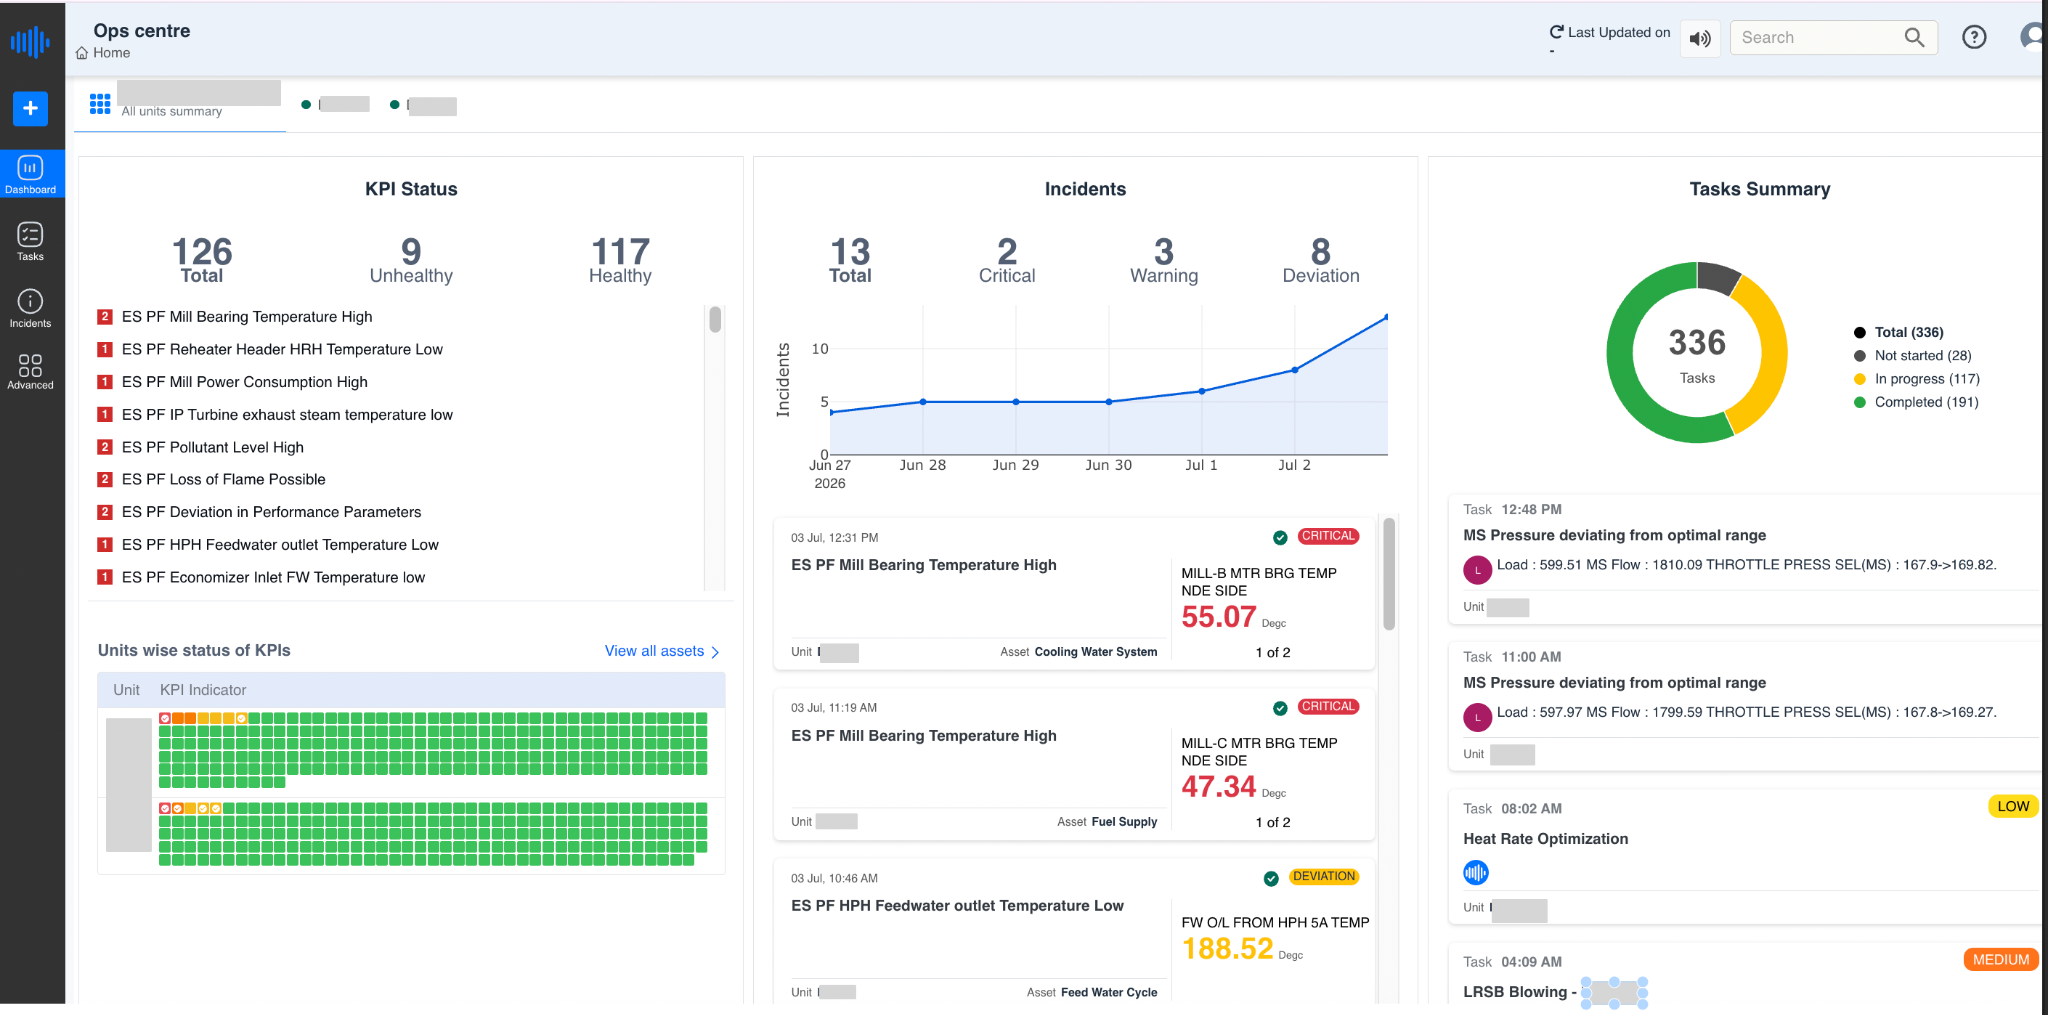
Figure 13. Operations Centre
¶ 5.1 Unit Overview
The Unit Overview tab displays the current operational condition of the selected unit. It brings together the most important operational information onto a single screen, allowing users to quickly determine whether the unit is operating normally or requires attention.
The page is divided into several information panels, each focusing on a different aspect of plant operation.
¶ 5.2 KPI Status
The KPI Status panel displays the health of all configured KPIs for the selected unit.
The panel shows:
-
Total KPIs being monitored
-
Healthy KPIs
-
Unhealthy KPIs
Below the summary, Pulse lists the KPIs currently outside their expected operating range. This allows users to immediately identify which process variables require further investigation.
¶ 5.3 Incidents
The Incidents panel provides a summary of all active incidents detected within the selected unit.
The panel displays:
-
Total incidents
-
Critical incidents
-
Warning incidents
-
Deviation incidents
Recent incidents are listed below the summary together with the affected asset, measured value, timestamp, and current severity.
Selecting an incident opens the Incident module where detailed diagnostic information can be reviewed.
¶ 5.4 Task Summary
The Task Summary panel provides an overview of maintenance and operational tasks generated within Pulse.
Tasks are grouped according to their current status, including:
-
Completed
-
In Progress
-
Not Started
Recent tasks are displayed below the chart, enabling users to monitor ongoing activities without opening the Task module.
Selecting a task opens the corresponding task record.
¶ 5.5 Unit-wise KPI Status
The Unit-wise KPI Status panel provides a graphical representation of KPI health across the selected unit.
Each coloured indicator represents the current status of an individual KPI.
This visualization helps engineers quickly identify systems that require attention without reviewing individual process tags.
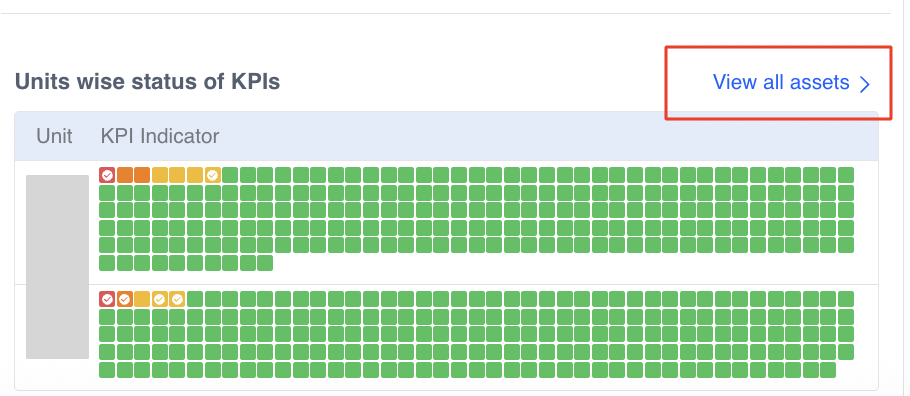
Figure 14. Unit Overview
Clicking on "View All Assets" from Unitwise status of KPI redirects user to Asset monitor Page of Pulse
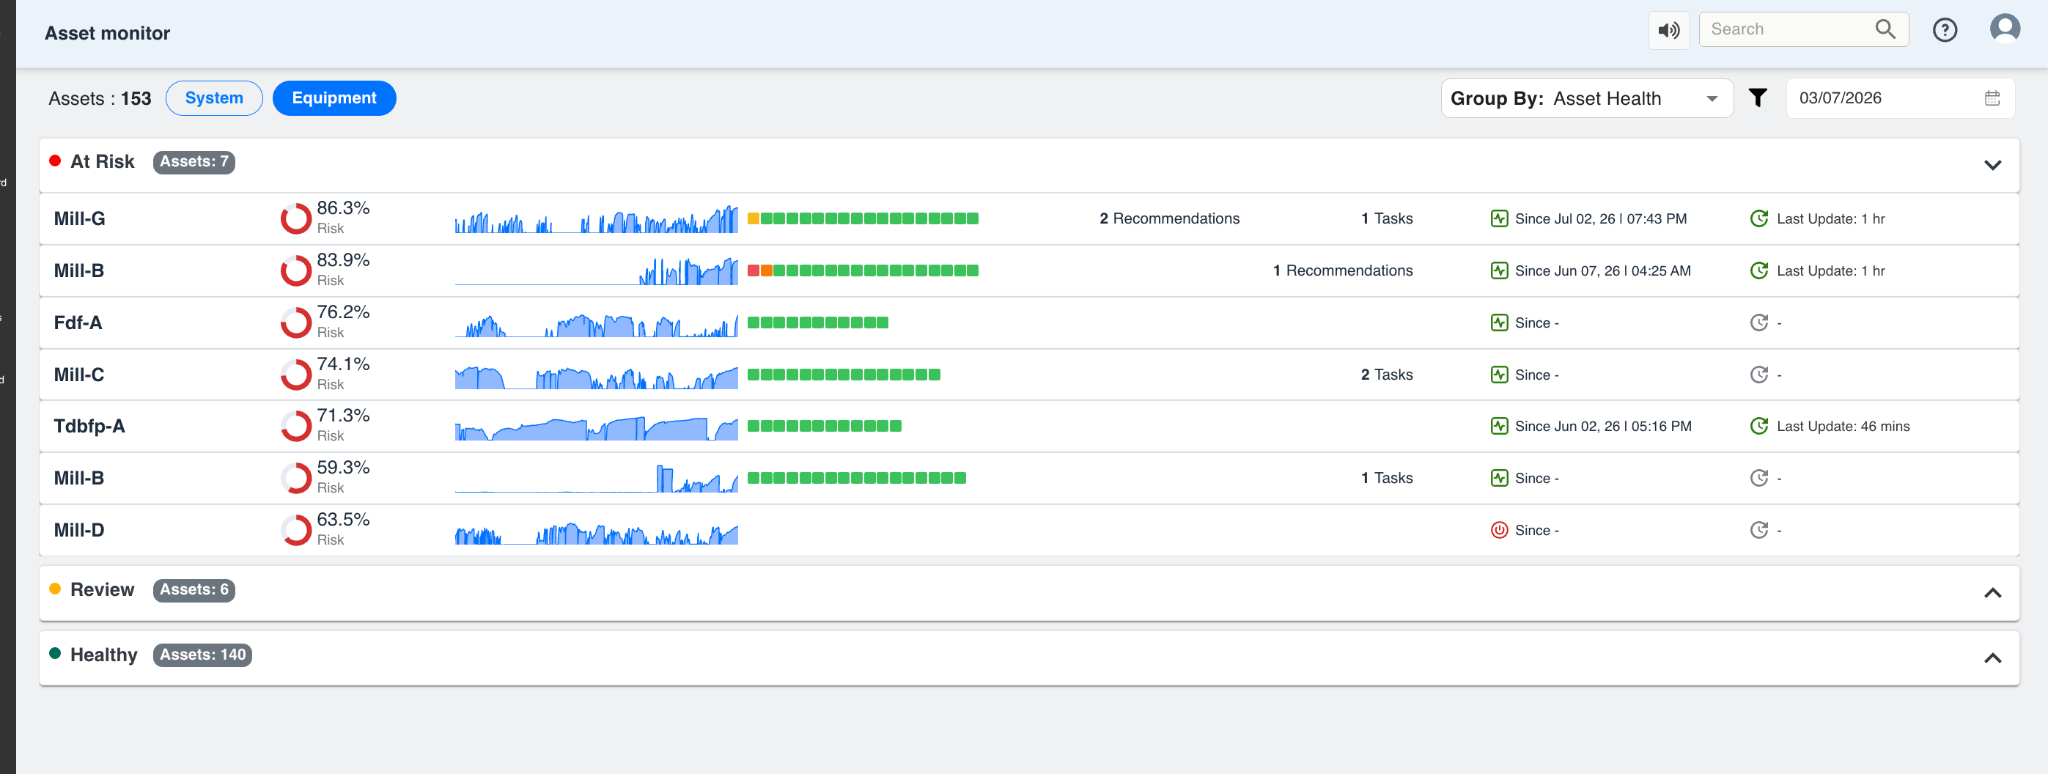
Figure 15. Asset Monitor
¶ 5.6 Timeline
The Timeline tab provides a chronological view of incidents and deviations recorded within the selected unit.
Instead of displaying events as a simple list, the Timeline presents them against a time scale, making it easier to understand when an event started, how long it remained active, and whether multiple events occurred simultaneously.
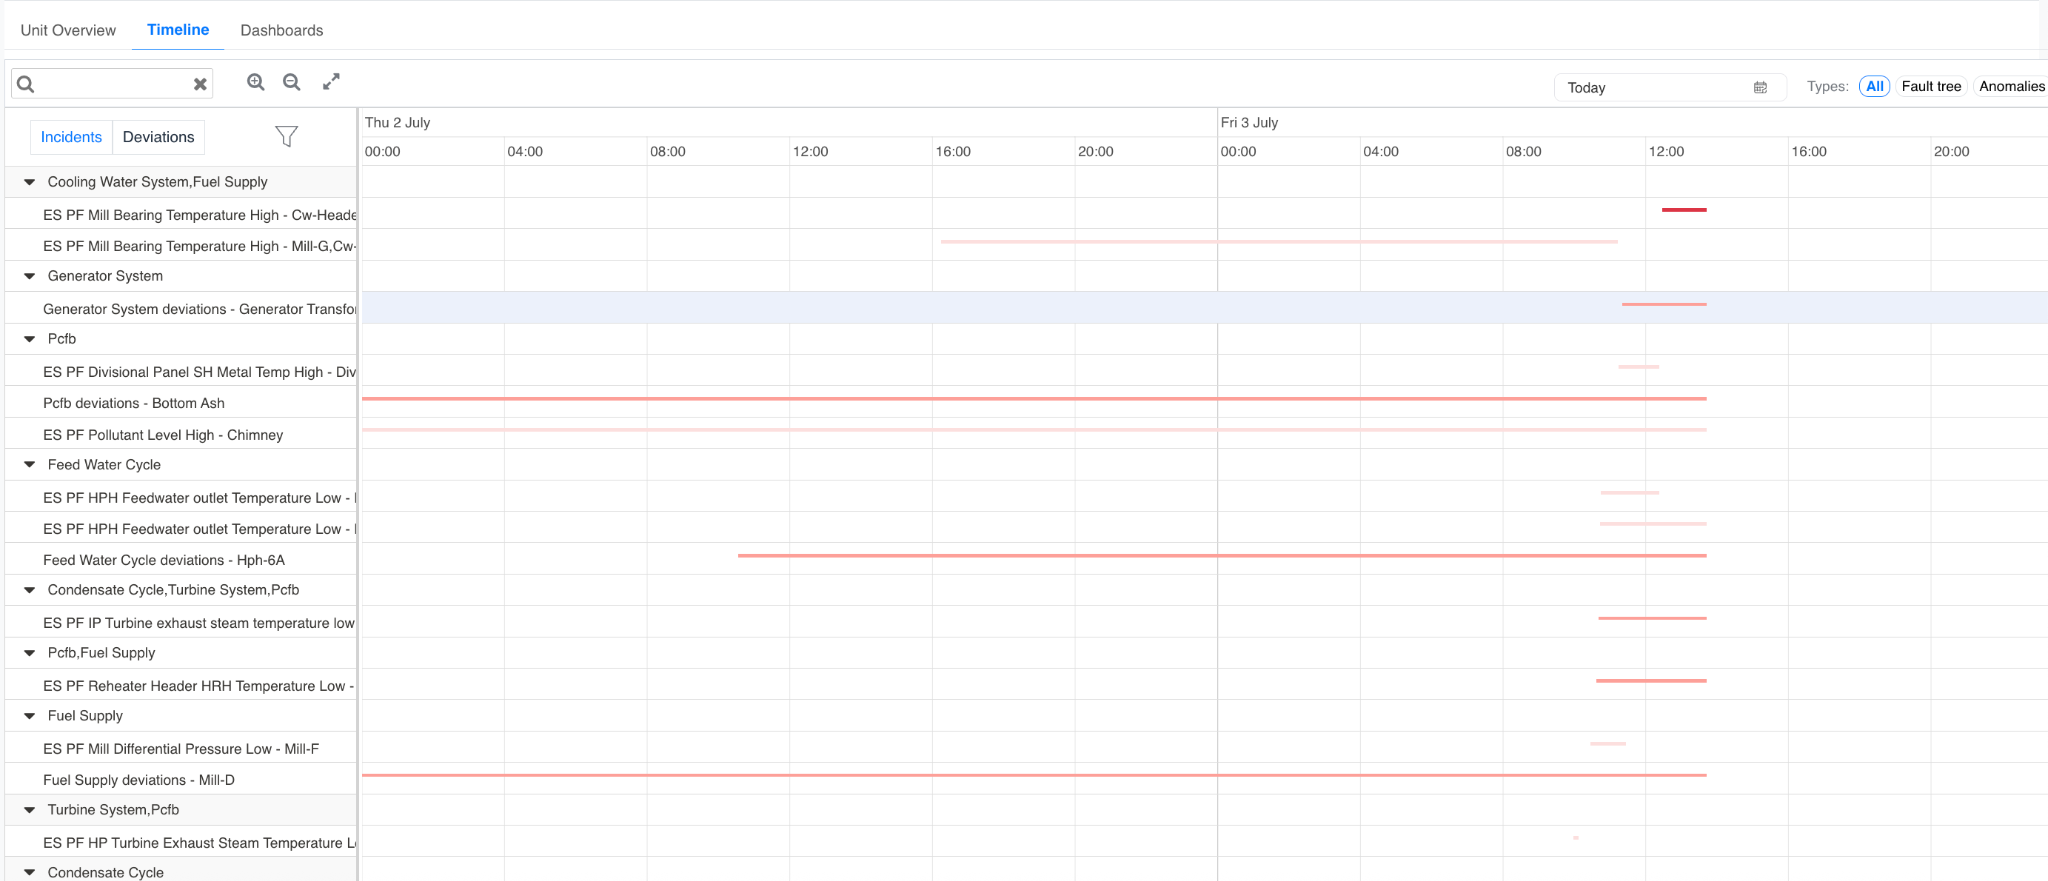
Figure 16. Timeline
The left side of the page displays the equipment hierarchy together with the recorded incidents and deviations.
The main timeline displays the duration of each event across the selected time period.
Users can filter the displayed information using the available controls, including:
-
Date
-
Event Type
-
Incidents
-
Deviations
-
Fault Tree Events
The Timeline is particularly useful during troubleshooting, as it helps engineers determine whether multiple events occurred at the same time or whether one event may have triggered another.
By analysing the sequence of events, engineers can better understand the progression of an operational issue before performing detailed root cause analysis.
¶ 5.7 Dashboards
The Dashboards tab provides engineering dashboards configured for the selected unit.
Unlike the Unit Overview page, which displays operational summaries, these dashboards provide detailed process visualizations and engineering KPIs.
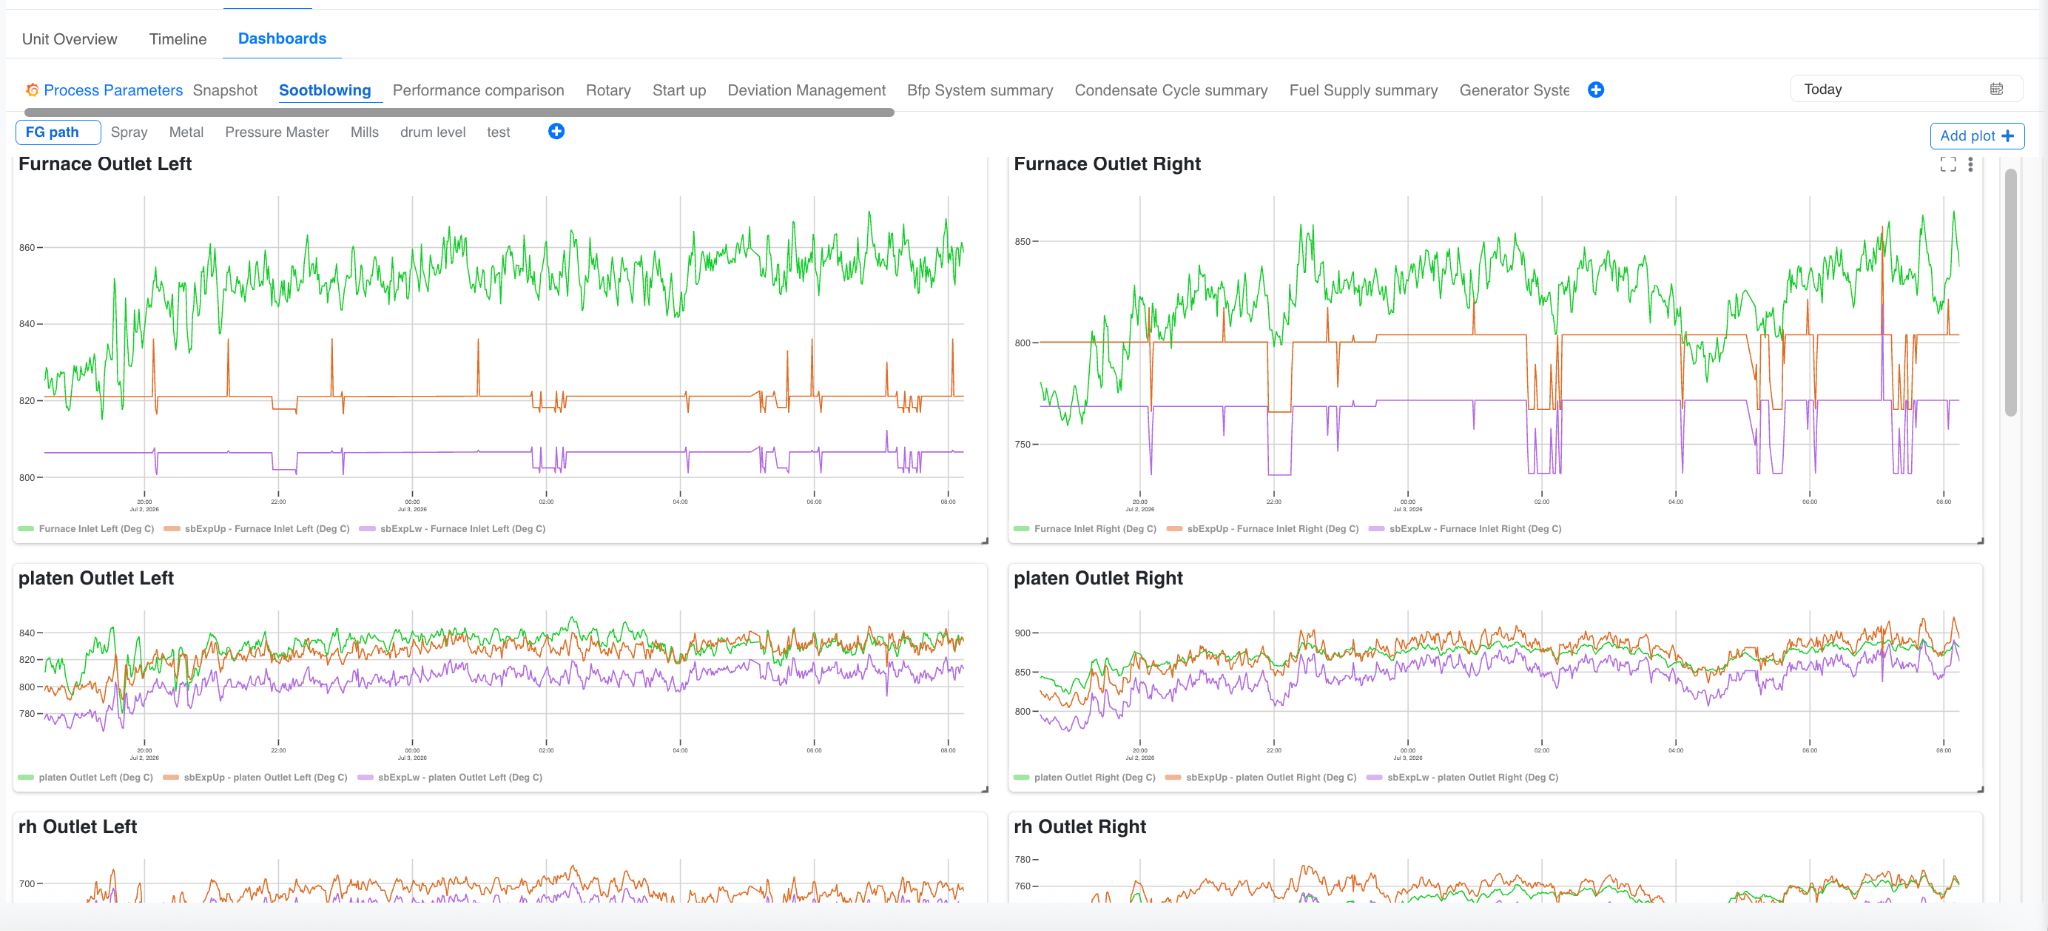
Figure 17. Engineering Dashboard
Each dashboard is organized into tabs based on the configured process or equipment group. Depending on the project implementation, examples may include:
-
Boiler
-
Turbine
-
Fuel Supply
-
Generator System
-
Performance Comparison
-
Start-up
-
Condensate Cycle
-
Deviation Management
Selecting a dashboard tab updates the page to display the corresponding engineering information.
The dashboard may include:
-
KPI gauges
-
Trend charts
-
Process graphs
-
Scatter plots
-
Contour plots
-
Performance indicators
These dashboards are designed to help engineers monitor process behaviour, compare operating conditions over time, and identify performance deviations.
The available dashboards and visualizations depend on the project configuration and the engineering models deployed for the client.
¶ 5.8 Creating a Dashboard
Pulse allows users with the appropriate permissions to create custom dashboards based on their monitoring and reporting requirements. Custom dashboards help users organize process parameters and visualizations according to their operational needs.
To create a new dashboard:
-
Open the Dashboards tab from the Operations Centre.
-
Click the + (Add) icon displayed next to the dashboard tabs.
-
The Create New Dashboard window is displayed.

Figure 18. Create New Dashboard
In the Create New Dashboard window, enter the required information:
-
Dashboard Title -- Enter a meaningful name for the dashboard.
-
View -- Select the dashboard view type from the available options.
-
Visibility Settings -- Specify whether the dashboard should be available only to you or shared with other users, depending on the configured permissions.
After entering the required information, click Create Dashboard. The new dashboard is added to the list of available dashboards and can be selected like any other dashboard.
¶ 5.9 Customizing a Dashboard
After a dashboard has been created, users can customize it by adding visual components that best represent the required process information.
Depending on the project configuration and user permissions, dashboards can be configured with different types of visualizations, such as:
-
Gauges
-
Trend charts
-
XY plots
-
Scatter plots
-
Process parameter charts
-
KPI indicators
-
Other supported visualization widgets
Users can also modify the dashboard layout by arranging visualizations according to their monitoring requirements. This allows each dashboard to focus on a specific process, equipment group, or operational objective.
Once configured, the dashboard is saved and becomes available whenever the selected unit is opened.
¶ 6. Task Management
The Task Management module enables users to create, assign, monitor, and close maintenance and operational activities within Pulse. It provides a centralized workspace for tracking all tasks generated either manually by users or automatically from incidents.
Tasks help ensure that identified issues are assigned to the appropriate personnel and remain traceable until they are completed.
Users can open the Task module by selecting the Tasks icon from the left navigation panel.
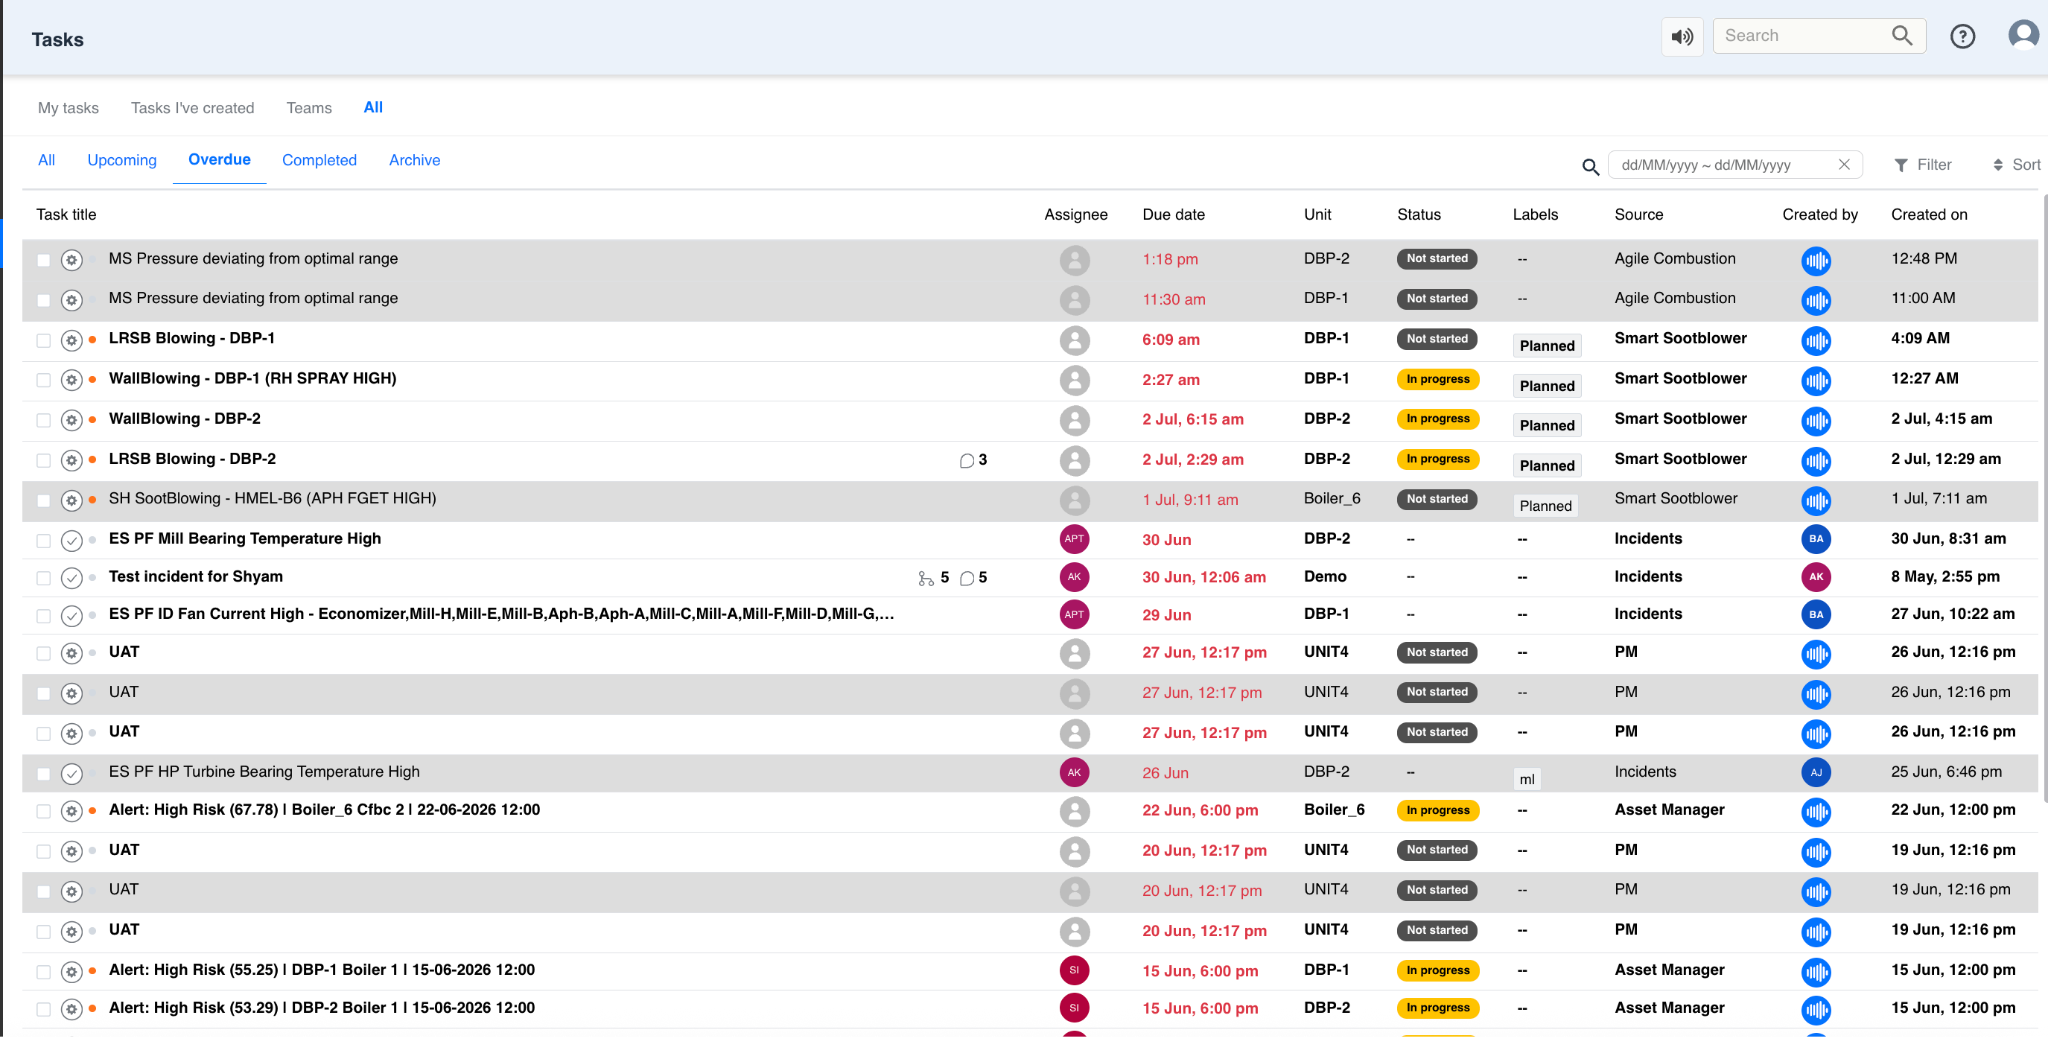
Figure 19. Task Module
¶ 6.1 Task Page Overview
The Task page displays all tasks available to the logged-in user for the selected unit.
The page provides a consolidated list of active and completed tasks together with important information required for tracking progress.
Depending on the configured view, the task list includes information such as:
-
Task Name
-
Assigned User
-
Asset
-
Priority
-
Current Status
-
Due Date
-
Creation Date
Users can sort or filter the task list to locate specific tasks quickly.
¶ 6.2 Creating a New Task
New tasks can be created directly from the Task module.
To create a task:
-
Open the Tasks module.
-
Click the + icon.
-
Select Task.
-
Enter the required task information.
-
Assign the task to the appropriate user.
-
Save the task.
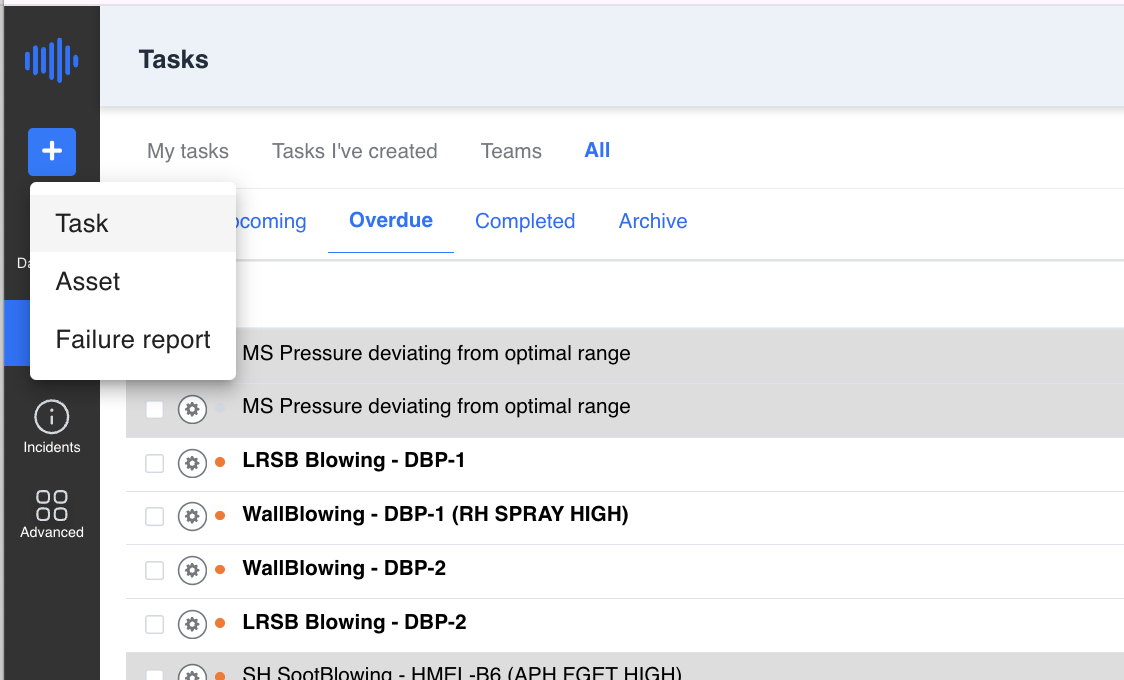
Figure 20. Creating a New Task
¶ 6.3 Task Details
Selecting a task opens the task details page.
The task details page contains complete information related to the selected task, including the work to be performed, assigned engineer, current status, and supporting information.
Depending on the project configuration, the task may also contain:
-
Description
-
Asset Information
-
Priority
-
Due Date
-
Attachments
-
Comments
-
Activity History
Users can update the task as work progresses until it is completed.
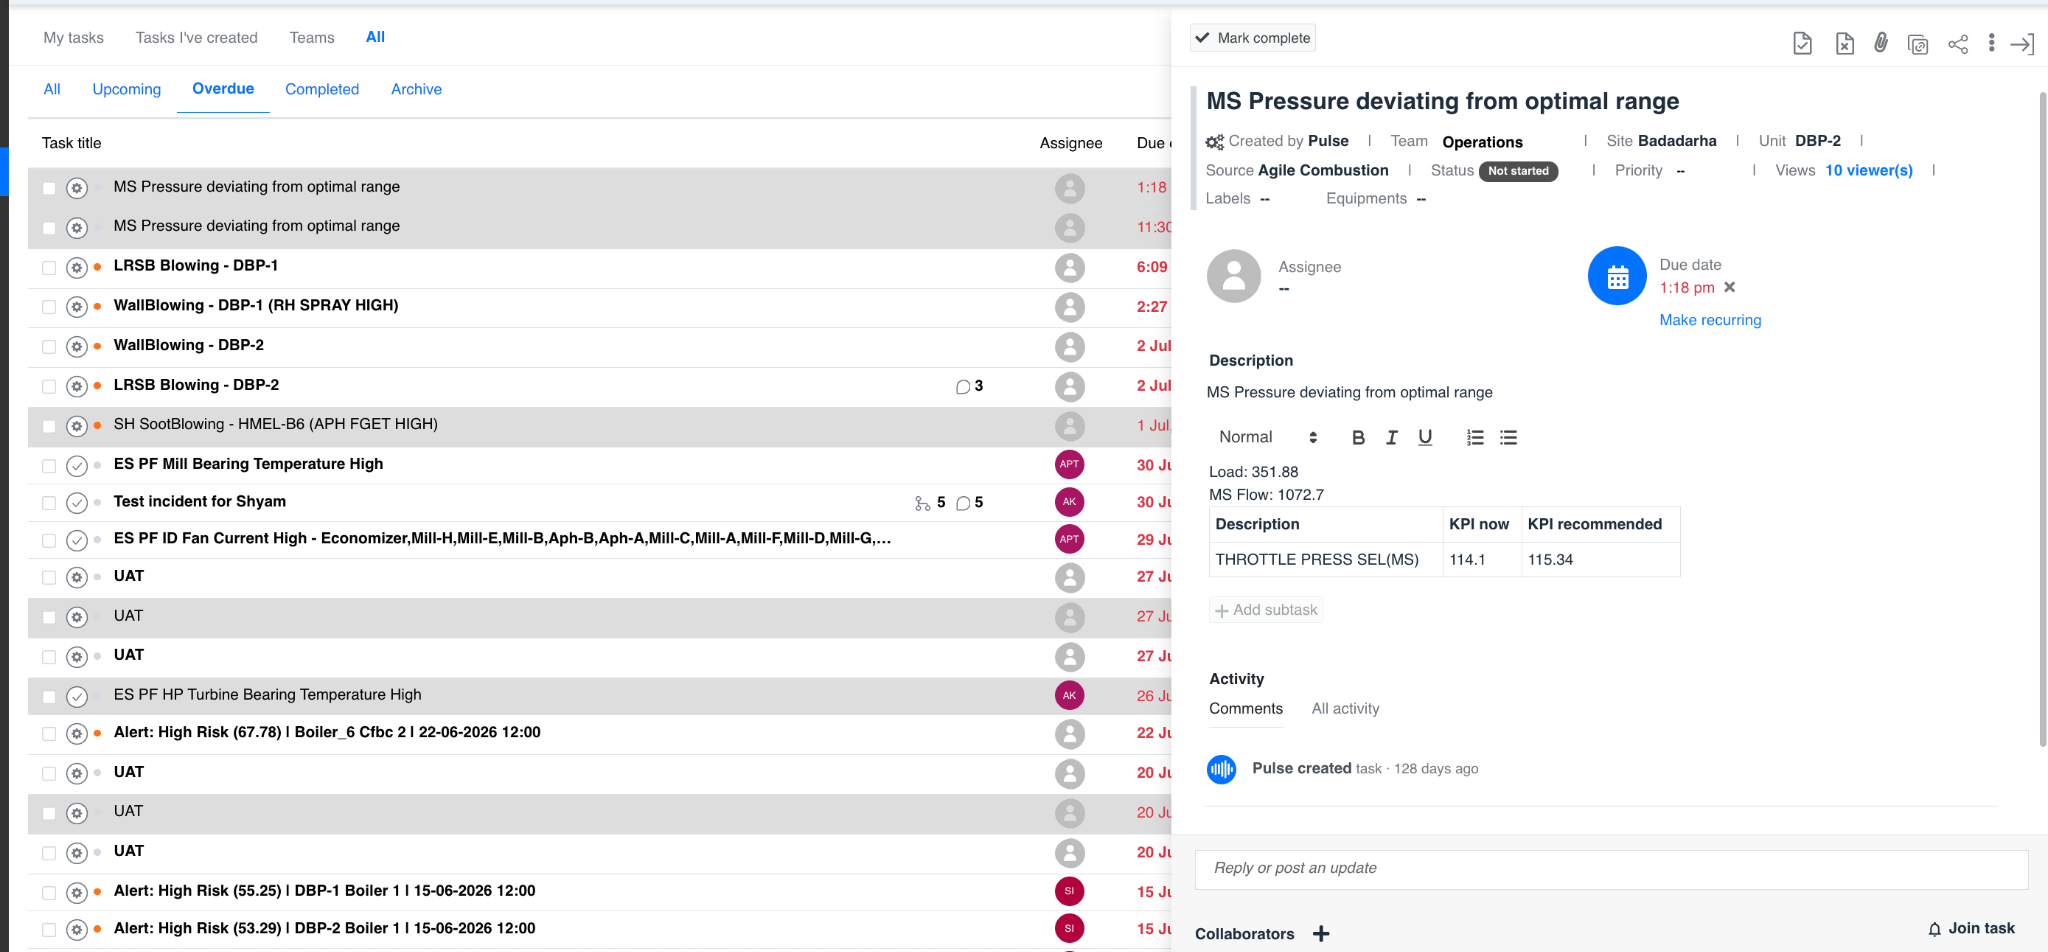
Figure 21. Task Details
¶ 6.4 Task Status
Each task progresses through different stages during its lifecycle.
The task status allows users to understand the current progress of work and helps supervisors monitor pending activities.
Typical task states include:
-
Open
-
In Progress
-
Completed
The available status values may vary depending on the project configuration.
¶ 6.5 Task Assignment
Tasks can be assigned to individual users based on their responsibilities.
After a task is assigned, the assigned user can update its progress, add comments, and mark the task as completed once the required work has been performed.
This helps maintain complete traceability of maintenance activities carried out within Pulse.
¶ 6.6 Task Search and Filters
The Task module provides search and filtering options to help users locate specific tasks.
Users can search tasks using available criteria such as:
-
Task Name
-
Status
-
Priority
-
Assigned User
-
Date Range
Filtering the task list enables users to focus on tasks relevant to their current work without reviewing the complete list.
¶ 7. Incident Management
The Incident module is used to monitor, investigate, and manage abnormal operating conditions detected by Pulse. Incidents are generated when the platform identifies deviations from expected operating behaviour based on configured rules, engineering calculations, predictive models, or fault tree evaluations.
The Incident module provides engineers with the information required to understand what has happened, which equipment is affected, and what action should be taken.
Users can open the Incident module by selecting the Incidents icon from the left navigation panel.
¶ 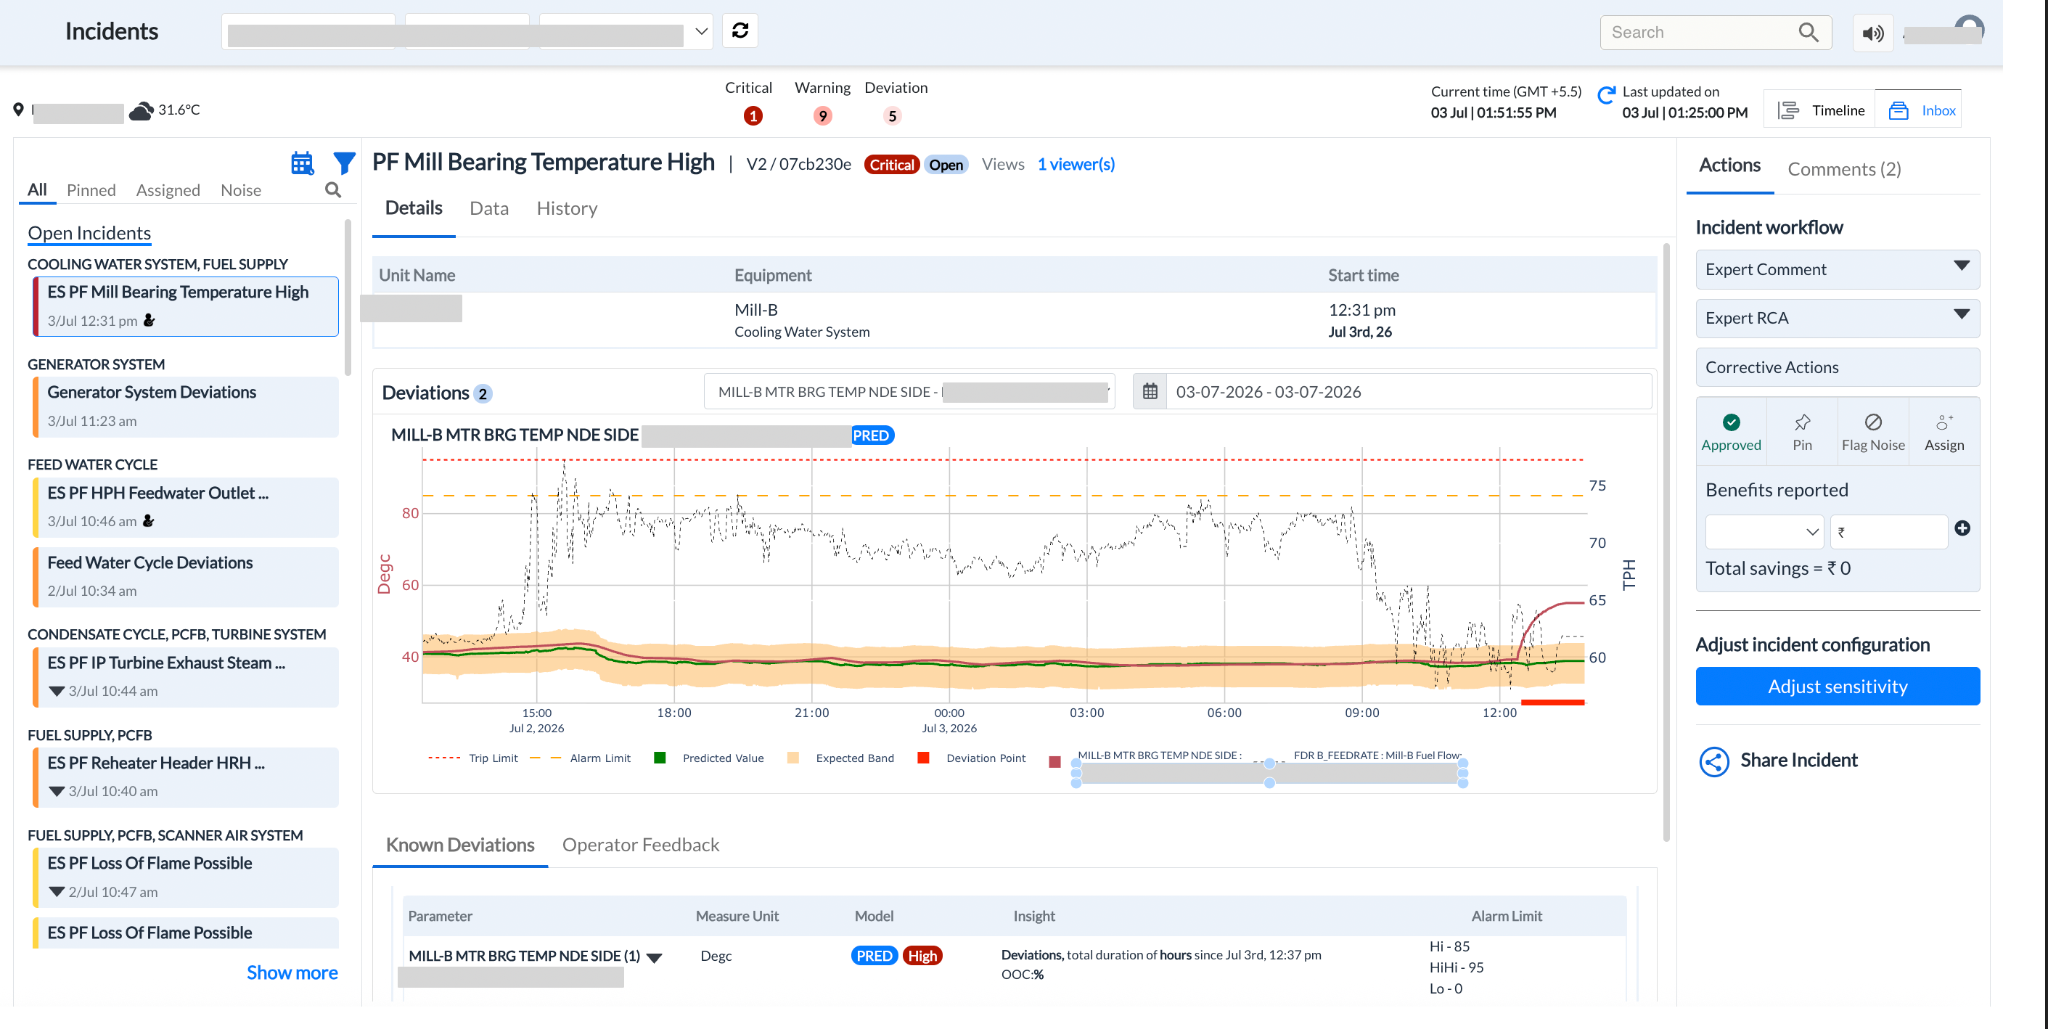
Figure 22. Incident Management Page
¶ 7.1 Incident Page Overview
The Incident page displays all active and historical incidents for the selected unit. Each incident contains important information that helps users understand the current condition of the affected asset.
Depending on the project configuration, the incident list displays information such as:
-
Incident title
-
Asset name
-
System
-
Severity
-
Date and time
-
Current status
Selecting an incident opens its detailed view where additional engineering information can be reviewed.
¶ 7.2 Understanding Incident Severity
Each incident is assigned a severity level based on the configured engineering logic.
The available severity levels are:
-
Critical -- Immediate attention is required.
-
Warning -- An abnormal condition has been detected and should be investigated.
-
Deviation -- The process has moved outside its expected operating range but may not require immediate action.
Severity helps engineers prioritize their investigation and maintenance activities.
¶ 7.3 Reviewing Incident Details
Selecting an incident opens the Incident Details page.
This page provides all available information related to the selected incident, allowing users to investigate the issue before taking corrective action.
The information displayed may include:
-
Incident description
-
Asset information
-
Time of occurrence
-
Current operating value
-
Severity
-
Engineering comments
-
Supporting charts and analysis
The exact information displayed depends on the configured engineering model for the selected asset.
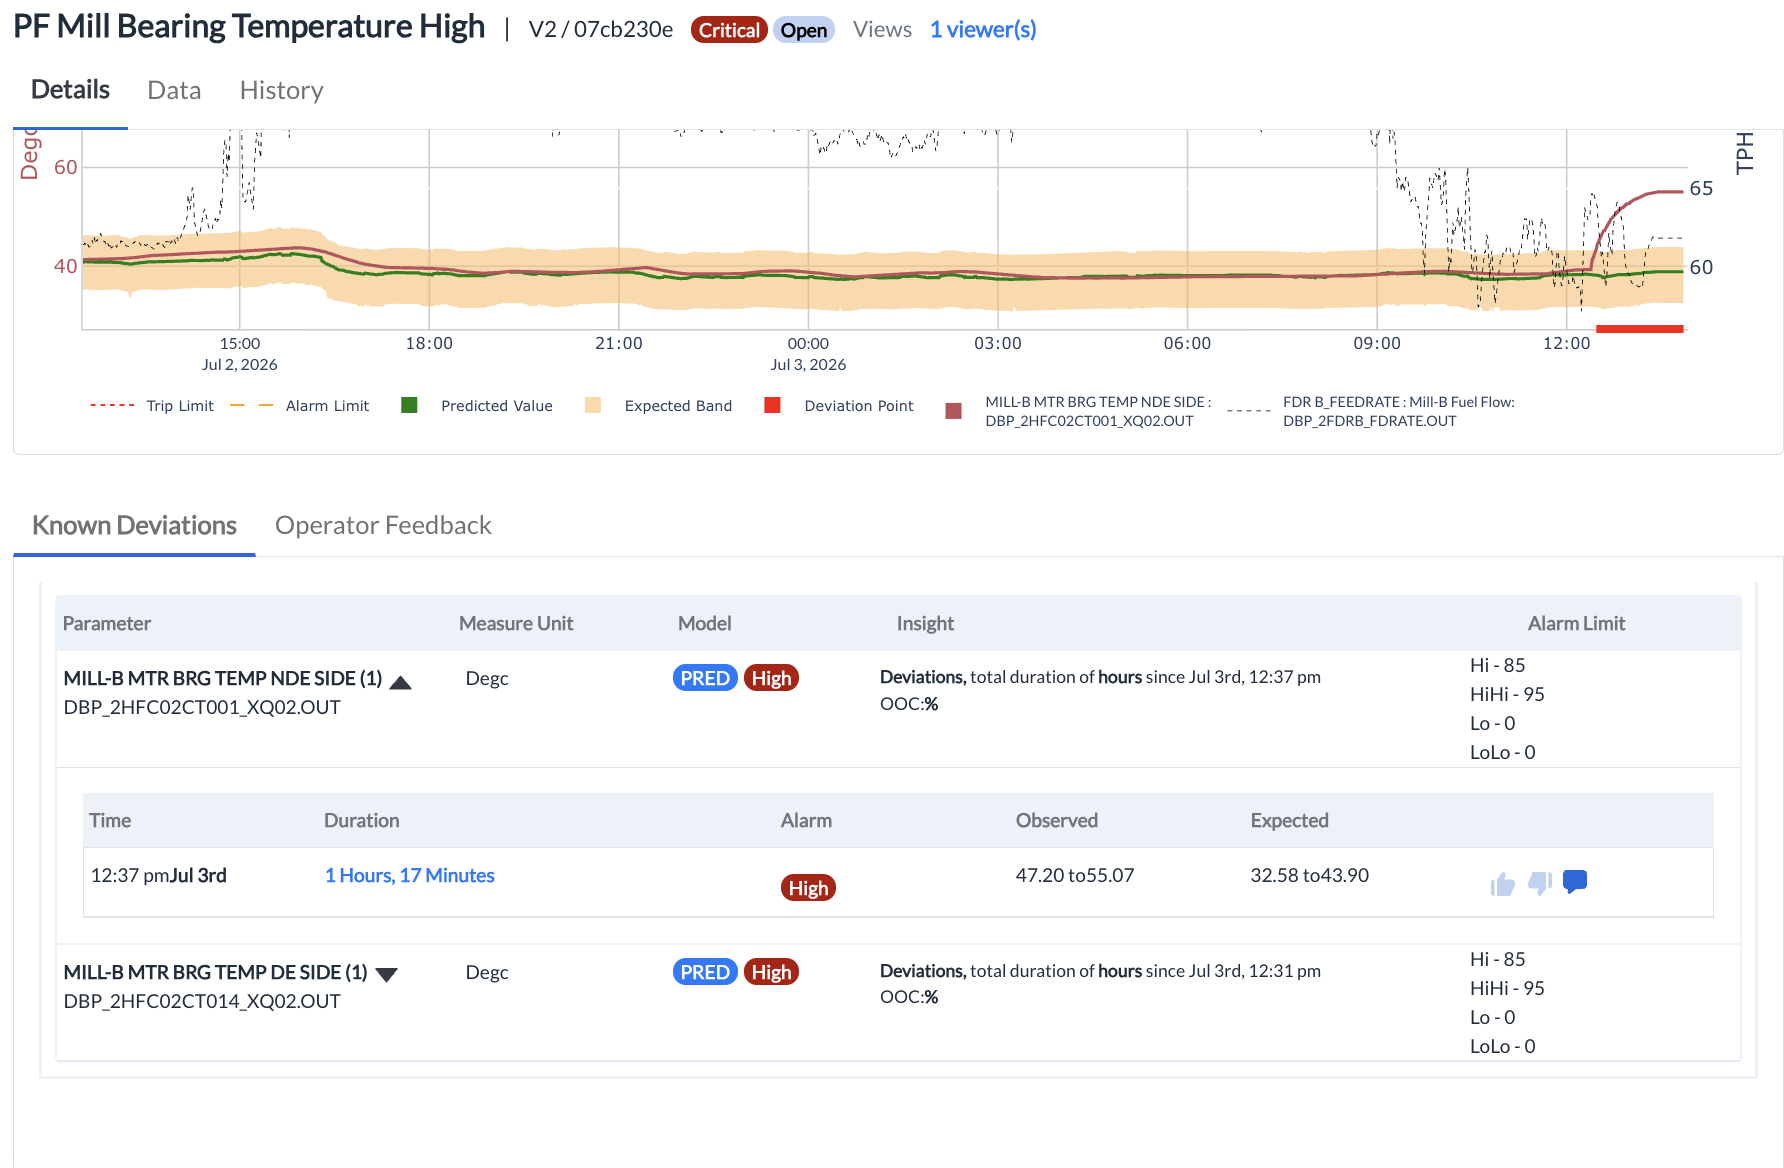
Figure 23. Incident Details
¶ 7.4 Engineering Analysis
The Incident Details page provides the engineering information required to understand the abnormal operating condition.
Depending on the configured models, users may review:
-
Process trends
-
Predicted values
-
Actual values
-
Related process variables
-
Historical behaviour
These visualizations help engineers compare current operating conditions with historical data and determine whether the incident represents a temporary process variation or an equipment issue requiring corrective action.
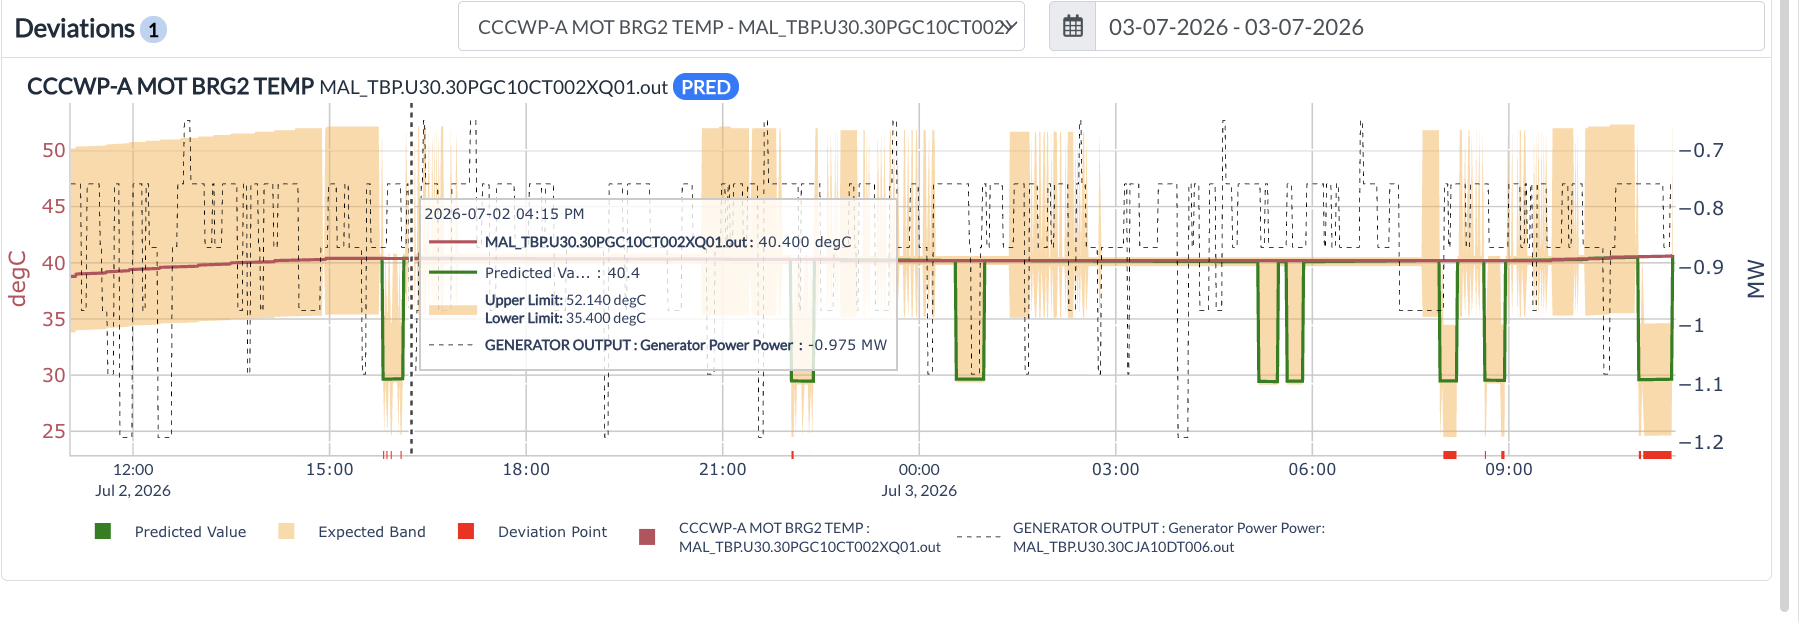
Figure 24. Incident Trend Analysis
¶ 7.5 Incident Actions
The Actions panel is available on the right side of the Incident Details page. It provides all the operational actions that can be performed on an incident during its lifecycle.
From this panel, engineers can record observations, document the root cause, assign the incident to other users, approve engineering findings, report operational benefits, and adjust incident monitoring settings.
The available actions may vary depending on the permissions assigned to the logged-in user.
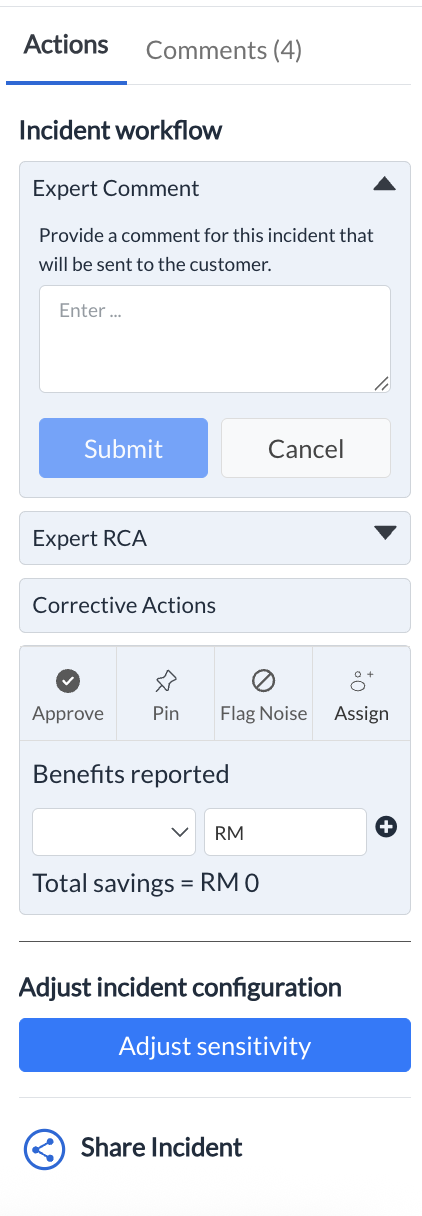
Figure 25. Incident Actions
¶ 7.5.1 Expert Comment
The Expert Comment section allows engineers to record observations related to the selected incident.
Comments entered here are intended to provide operational updates, investigation findings, or recommendations during the incident review process.
After entering the required information, click Submit to save the comment. The comment becomes part of the incident record and can be viewed from the Comments tab.
This helps maintain a complete audit trail of the investigation and allows different users to collaborate on the same incident.

¶ 7.5.2 Expert RCA
The Expert RCA (Root Cause Analysis) section is used to document the actual cause of the incident after site investigation.
Engineers can record the findings identified during inspection, testing, or troubleshooting activities. This information becomes part of the permanent incident history and serves as a reference for future investigations.
Recording the root cause helps improve engineering knowledge and supports continuous improvement activities.
¶ 7.5.3 Corrective Actions
The Corrective Actions section is used to record the actions taken to resolve the identified issue.
Depending on the project workflow, this section may include maintenance activities, operational changes, inspection details, or recommendations provided by the engineering team.
Maintaining corrective action records allows users to track how similar incidents were resolved and supports future troubleshooting activities.
¶ 7.5.4 Incident Workflow Actions
Below the investigation sections, Pulse provides several workflow actions that help manage the incident throughout its lifecycle.
Available actions include:
-
Approve -- Confirms that the investigation or engineering review has been completed.
-
Pin -- Marks the incident as important for quick access from the incident list.
-
Flag Noise -- Marks an incident as noise when it is determined to be a false or non-actionable alert. This helps improve the quality of future monitoring.
-
Assign -- Assigns the incident to another user for further investigation or follow-up.
These actions support collaboration between operations, maintenance, and reliability teams.
¶ 7.5.5 Benefits Reported
After an incident has been investigated, users can record the operational benefit achieved by taking corrective action.
The Benefits Reported section provides predefined benefit categories such as:
-
Avoid Equipment Failure
-
Avoid Shutdown
-
Reduced Energy Costs
-
Better Maintenance
-
Performance Improvement
Users can select the applicable category and enter the estimated savings amount.
The total reported savings are displayed within the same section and can be used for reporting the value delivered through predictive maintenance.
¶ 7.5.6 Adjust Incident Configuration
If required, authorized users can modify the monitoring behaviour of the selected incident by clicking Adjust Sensitivity.
This option allows engineering teams to fine-tune the monitoring configuration for the asset when repeated false alerts or changing operating conditions require adjustment.
Only users with appropriate permissions should modify these settings.
¶ 7.5.7 Share Incident
The Share Incident option allows users to share the incident details with other authorized users for review and collaboration.
This feature helps communicate important operational issues without requiring users to manually copy incident information.
¶ 7.6 Incident Data Tab
The Data tab provides the graphical representation of the process values associated with the selected incident.
It displays the measured process variable over the selected time period together with the prediction band generated by the configured model.
The graph allows engineers to compare actual operating behaviour with the expected operating range and identify the duration and magnitude of the deviation.
Users can change the time period using the date and time selector available above the graph.
The Data tab is primarily used during incident investigation to understand when the deviation started, how long it continued, and whether the process has returned to normal operating conditions.
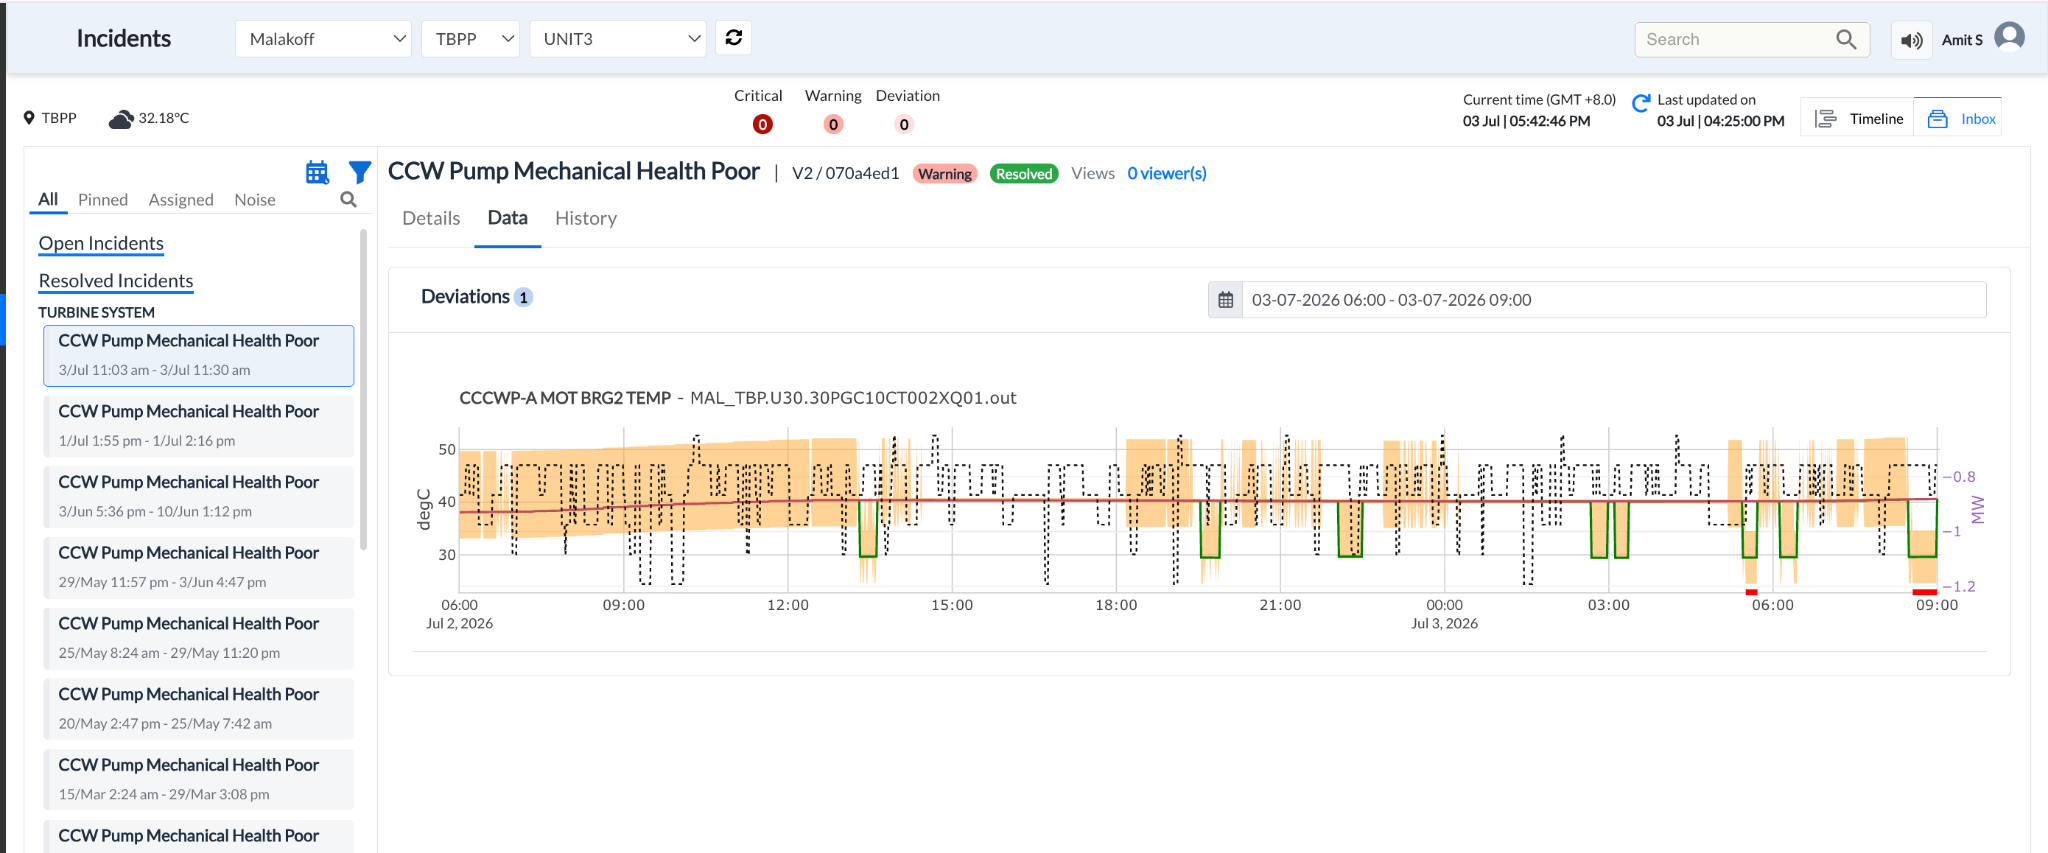
Figure 26. Incident Data View
¶ 7.7 Incident History
The History tab provides a chronological record of previous occurrences of the selected incident.
Each record includes:
-
Month
-
Start Time
-
End Time
-
Number of Deviations
-
View option
Selecting View opens the corresponding historical record, allowing engineers to review previous occurrences and compare them with the current incident.
The History tab helps identify recurring equipment problems and repeated operating patterns, enabling maintenance teams to determine whether a permanent corrective action is required instead of repeatedly addressing the same issue.
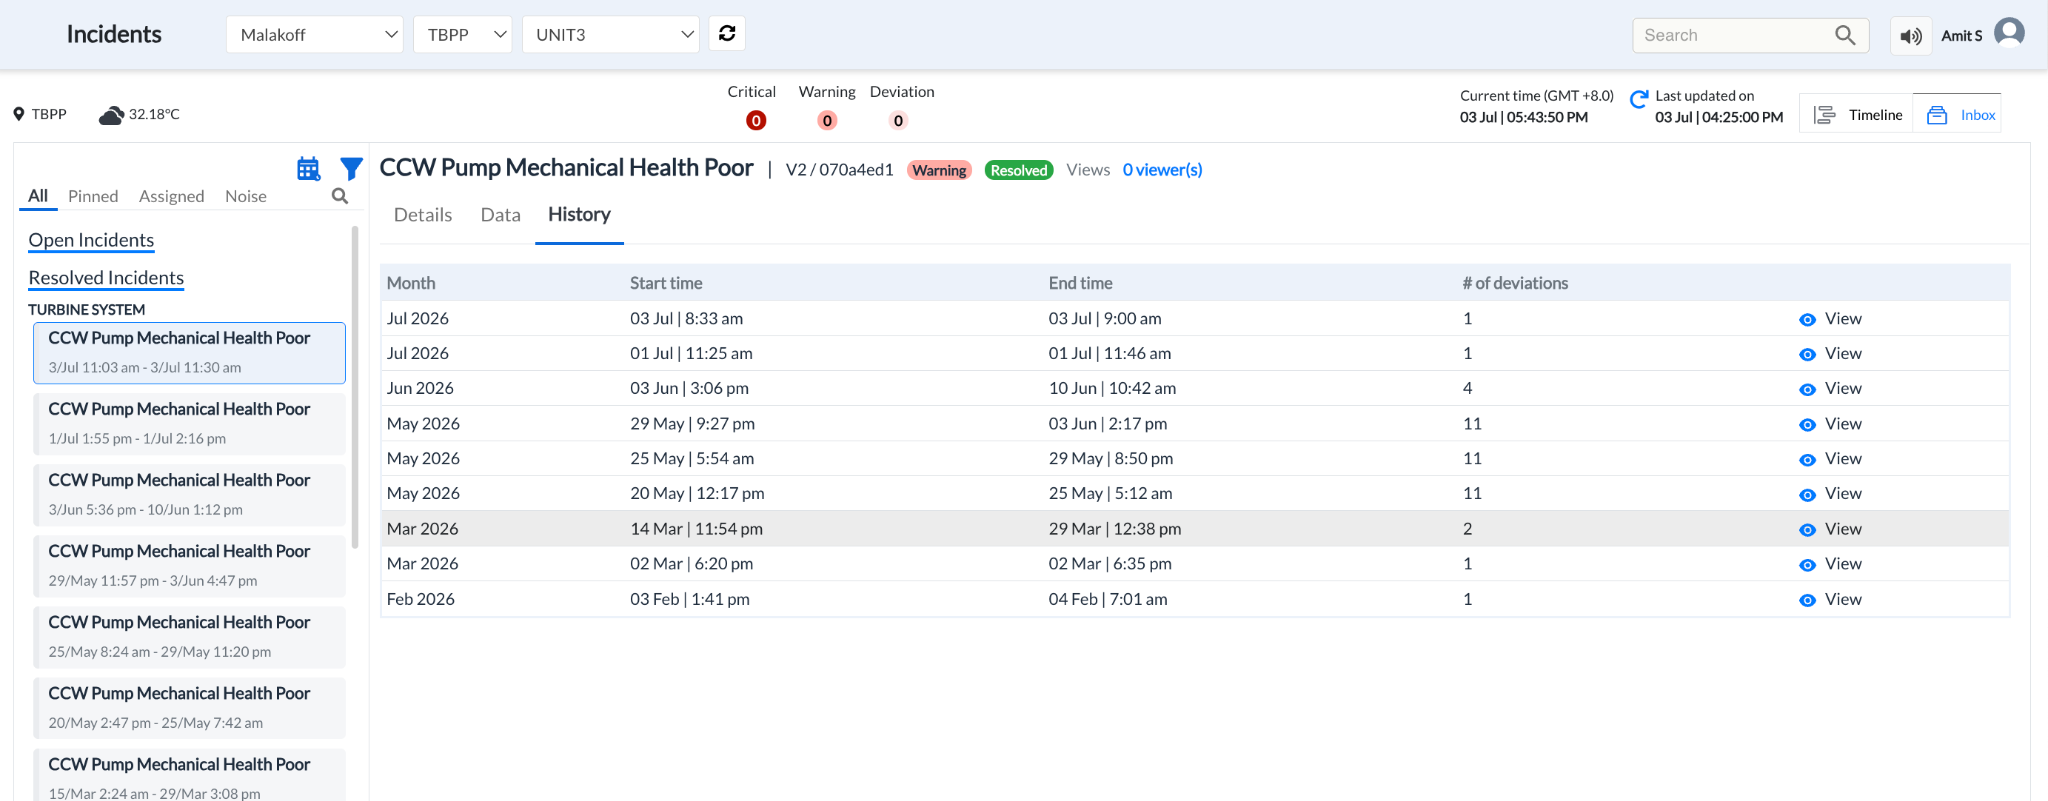
Figure 32. Incident History
¶ 8. Asset Monitor
The Asset Monitor module provides a centralized view of the health and operational condition of all monitored assets. It enables users to identify equipment that requires attention based on its current health status, risk score, and historical operating behaviour.
Unlike the Dashboard, which provides a summary of plant operations, the Asset Monitor focuses on individual assets. It allows users to review asset health, investigate previous incidents, analyse equipment history, and access engineering information related to a selected asset.
Assets can be grouped based on different criteria, allowing users to quickly identify equipment that requires immediate attention.
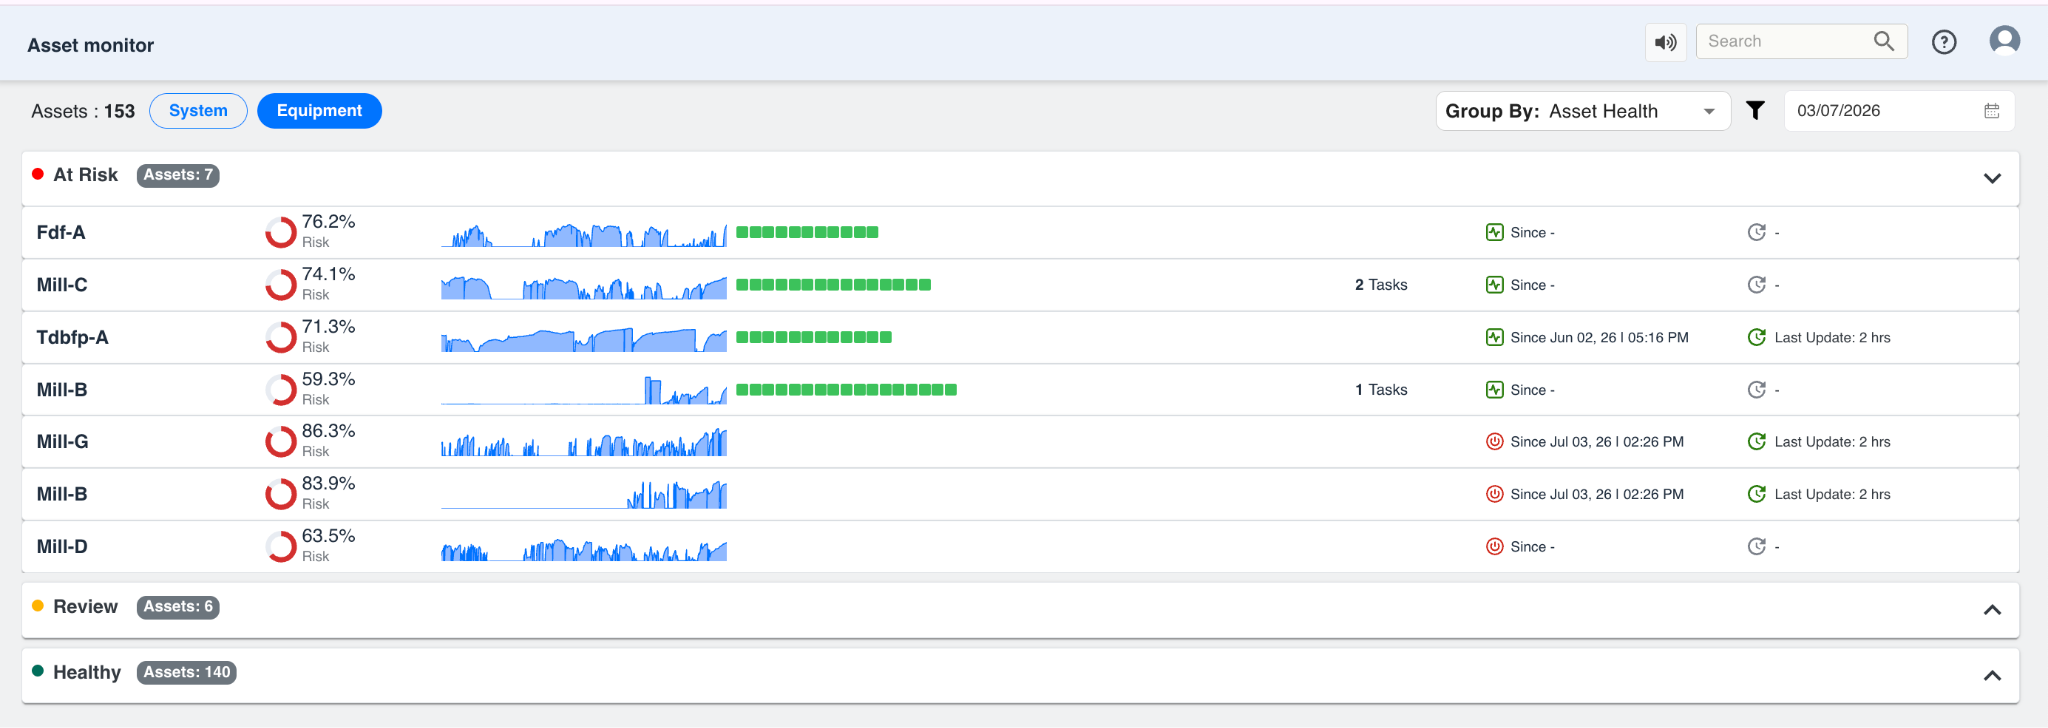
Figure 28. Asset Monitor Landing Page
¶ 8.1 Asset Monitor Overview
The Asset Monitor page displays all monitored assets along with their current operational status.
Assets are grouped into three categories:
-
At Risk -- Assets currently showing abnormal operating conditions and requiring engineering attention.
-
Review -- Assets that should be reviewed based on recent observations or changing operating conditions.
-
Healthy -- Assets operating within their expected range without any active issues.
Each asset card displays important information including:
-
Asset name
-
Risk score
-
Health indicator
-
Recent trend
-
Current task count
-
Active monitoring status
-
Last update time
This enables users to identify equipment that requires investigation without opening each asset individually.
¶ 8.2 Asset Grouping and Filtering
The Asset Monitor provides multiple options to organize the asset list.
Users can switch between:
-
System View
-
Equipment View
The Group By option allows assets to be organised based on different criteria such as Asset Health.
Additional filters can be applied to display only the required assets for a selected date or operating condition.
These options help users focus on a specific group of assets during daily monitoring activities.
¶ 8.3 Asset Health Indicators
Each asset is assigned a health status based on the engineering models and monitoring rules configured within Pulse.
The health indicator provides a quick understanding of the current operating condition.
The displayed information includes:
-
Current risk percentage
-
Recent operating trend
-
Overall health status
-
Number of active tasks (if applicable)
-
Monitoring duration
-
Last updated time
The risk value is recalculated continuously as new process data becomes available.
Assets with higher risk values should be reviewed to determine whether further investigation is required.
¶ 8.4 Asset Actions
Each asset provides quick access to commonly used actions.
Depending on user permissions, the following options are available:
-
Create Task -- Creates a maintenance or investigation task for the selected asset.
-
Report Failure -- Records an equipment failure associated with the selected asset.
-
Actions -- Displays additional actions available for the selected asset.
These options allow users to initiate follow-up activities directly from the Asset Monitor without navigating to other modules.
¶ 8.5 Opening an Asset
Selecting an asset from the Asset Monitor opens the detailed Asset page.
The Asset Details page provides additional engineering information related to the selected equipment.
This page contains multiple tabs that allow users to review different aspects of asset performance.
The available tabs include:
-
Process
-
History
-
PM
-
KPI
-
Attachments
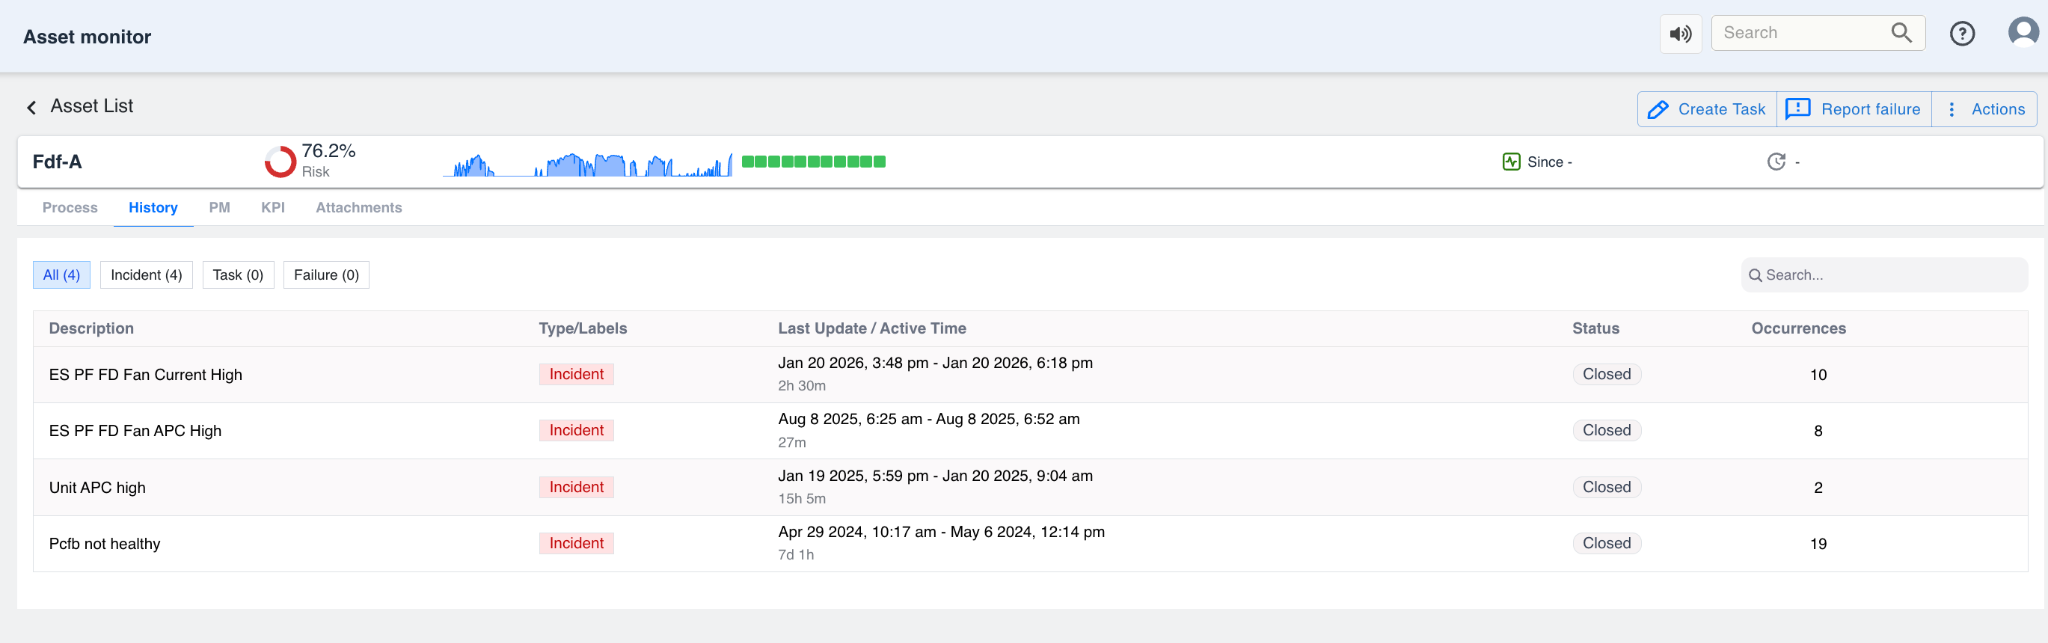
Figure 29. Asset Details Page
¶ 8.6 Asset Information Tabs
The Asset Details page is organised into separate tabs to simplify navigation and provide quick access to different categories of information.
Each tab focuses on a specific aspect of asset monitoring.
-
Process: Displays process-related information and operational data associated with the selected asset.
-
History: Displays previous incidents, failures, and historical events associated with the asset.
-
PM : Displays preventive maintenance information configured for the asset.
-
KPI: Displays historical KPI events and performance-related information.
-
Attachments: Displays files or supporting documents associated with the asset, if configured.
¶ 8.7 Asset History
The History tab provides a chronological record of incidents and failures that have occurred for the selected asset.
Users can filter the information using:
-
All
-
Incident
-
Task
-
Failure
For each record, Pulse displays:
-
Description
-
Type or Label
-
Last Update
-
Active Duration
-
Status
-
Number of Occurrences
This information allows engineers to understand whether an issue is recurring and how frequently similar events have occurred in the past.
Historical information is useful when analysing long-term equipment behaviour and identifying recurring operational problems.
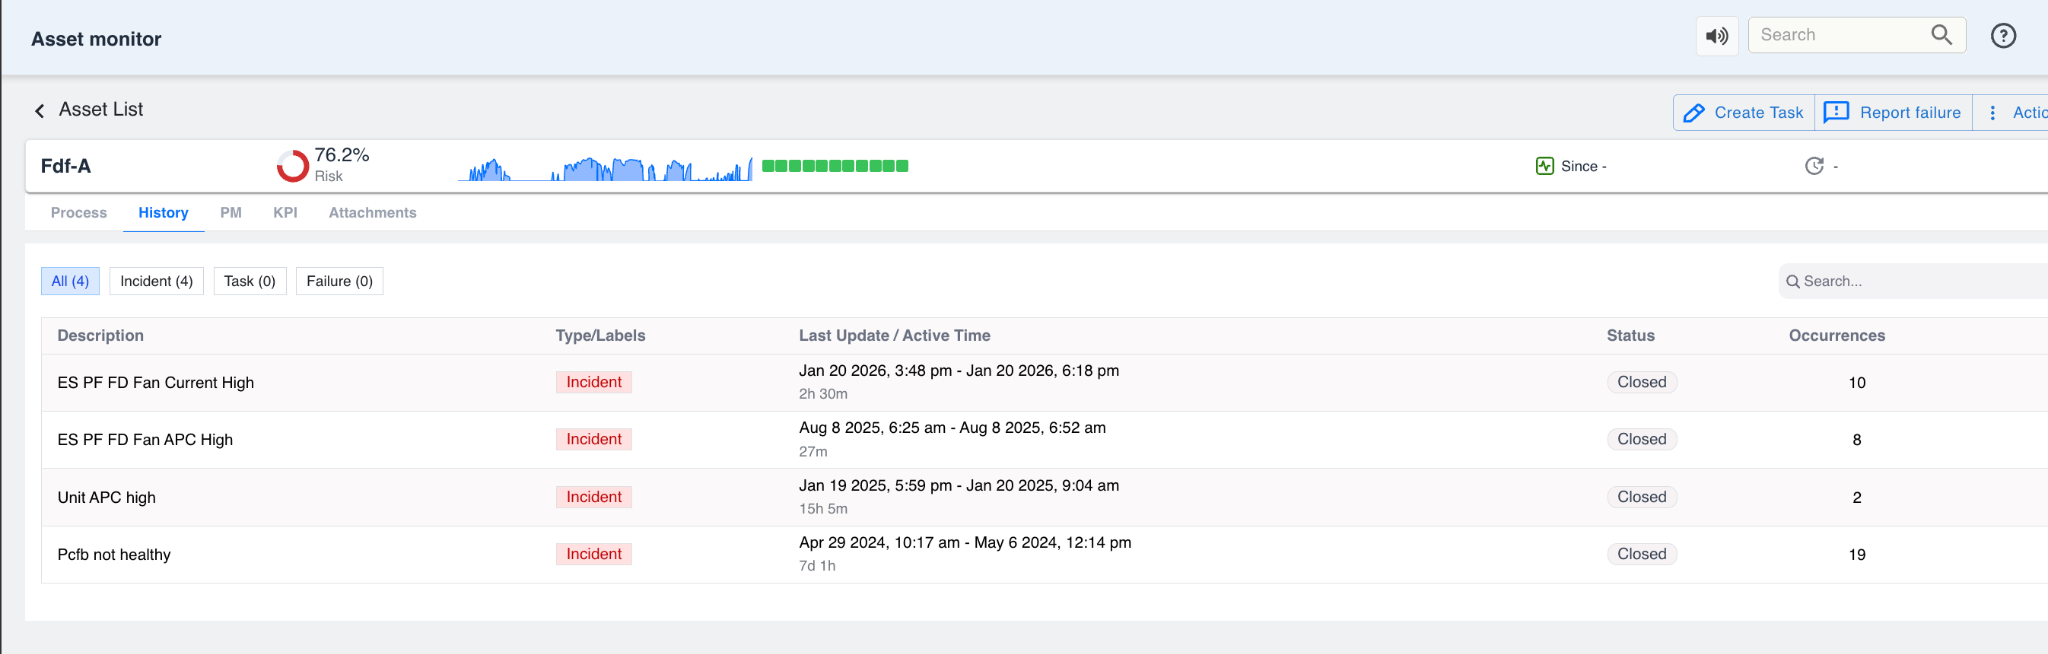
Figure 30. Asset History
¶ 8.8 KPI Timeline
The KPI tab provides a timeline view of historical KPI events associated with the selected asset.
The timeline displays when individual KPI events occurred and helps engineers understand the frequency and distribution of operational issues over time.
Users can:
-
Search for a specific KPI
-
Select the required time window
-
Show or hide failure events
-
Zoom into a specific time period
The timeline provides a visual representation of historical equipment behaviour and assists in identifying recurring operational patterns.
By reviewing the KPI timeline together with incident history, engineers can determine whether repeated issues are isolated events or part of an ongoing equipment problem.
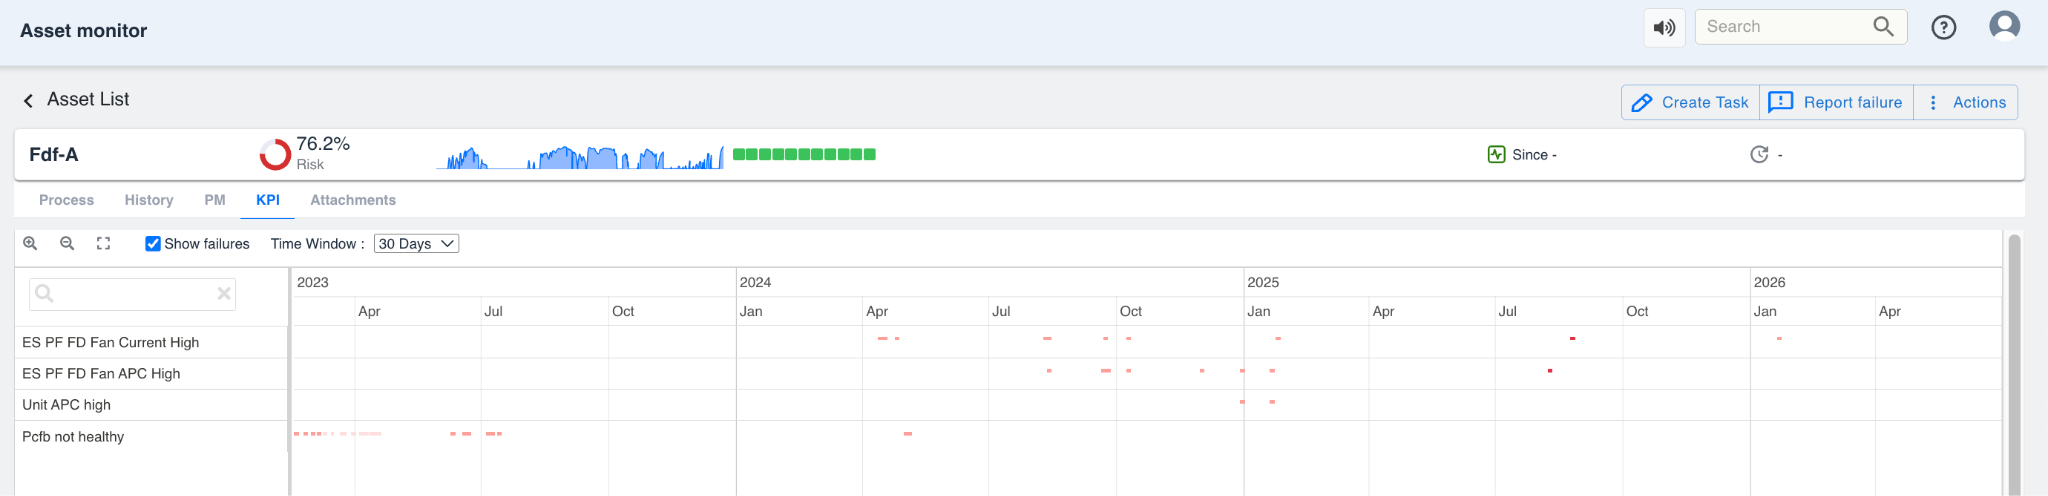
Figure 31. KPI Timeline
¶ 9. Performance
The Performance module is used to evaluate the operating performance of plant systems over a selected period. It compares the current operating values with design values and the best historical performance recorded by the system.
This module helps engineers identify performance losses, monitor equipment efficiency, and understand where operational improvements can be made. Rather than displaying live process values, the Performance module presents comparison reports for selected time periods.
Users can generate daily, weekly, monthly, or yearly reports based on the available historical data.
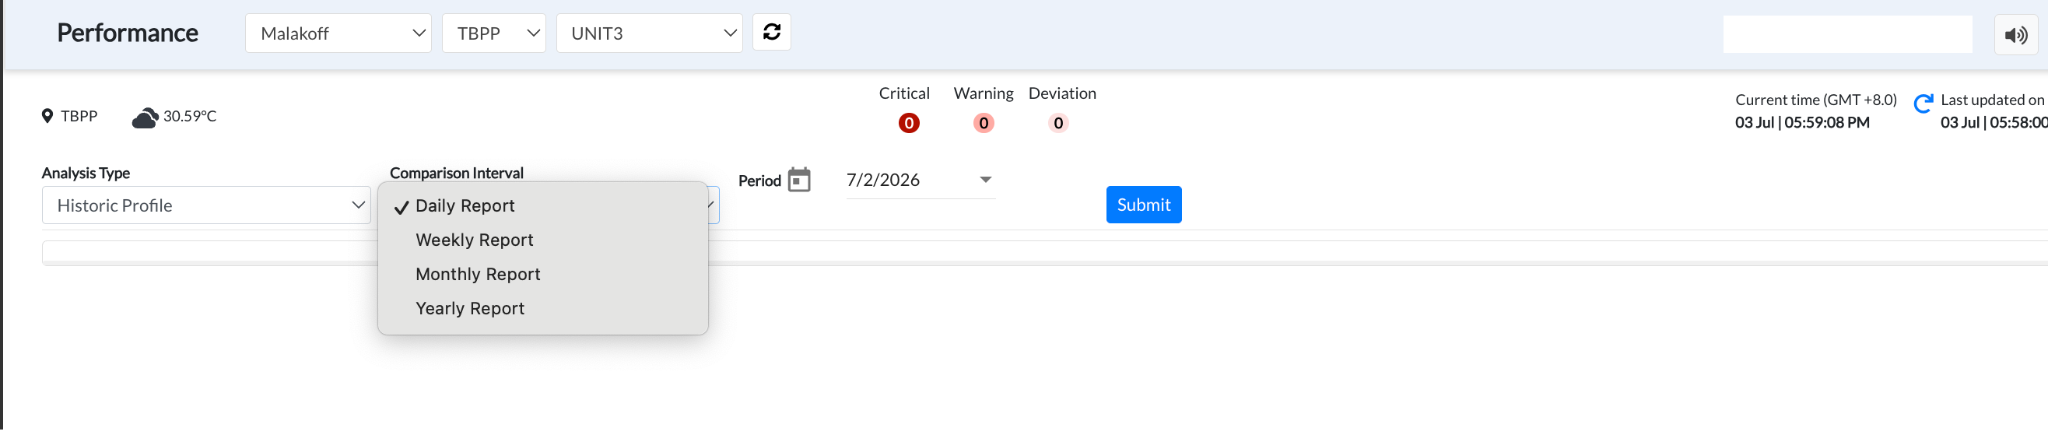
Figure 32. Performance Module
¶ 9.1 Performance Module Overview
The Performance page allows users to generate performance reports for different plant systems by selecting the required analysis period.
Before generating a report, users can configure the following parameters:
-
Analysis Type
-
Comparison Interval
-
Reporting Period
-
Report Date
After selecting the required options, click Submit to generate the performance report.
The generated report displays the performance of the selected system along with engineering comparison values.
¶ 9.2 Selecting the Analysis Type
The Analysis Type determines the type of performance evaluation that will be generated.
Depending on the project configuration, different analysis types may be available. In the current implementation, the available option is:
- Historic Profile
The Historic Profile compares the selected operating period against historical plant data and displays performance information for the selected system.
¶ 9.3 Selecting the Comparison Interval
The Comparison Interval defines the reporting duration used for performance analysis.
The available options include:
-
Daily Report
-
Weekly Report
-
Monthly Report
-
Yearly Report
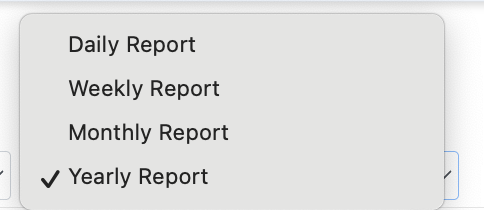
Figure 33. Comparison Interval
The selected interval determines the amount of historical data included in the generated report. For example, a Daily Report analyses performance for a single day, while a Yearly Report provides a comparison across the selected year.
¶ 9.4 Generating a Performance Report
To generate a report:
-
Select the required Analysis Type.
-
Select the Comparison Interval.
-
Choose the reporting date or period.
-
Click Submit.
Pulse retrieves the relevant historical data and generates the performance comparison report for the selected period.
The report displays one or more plant systems depending on the project configuration.
¶ 9.5 Understanding the Performance Report
Once the report is generated, the Performance module displays engineering parameters for the selected system.
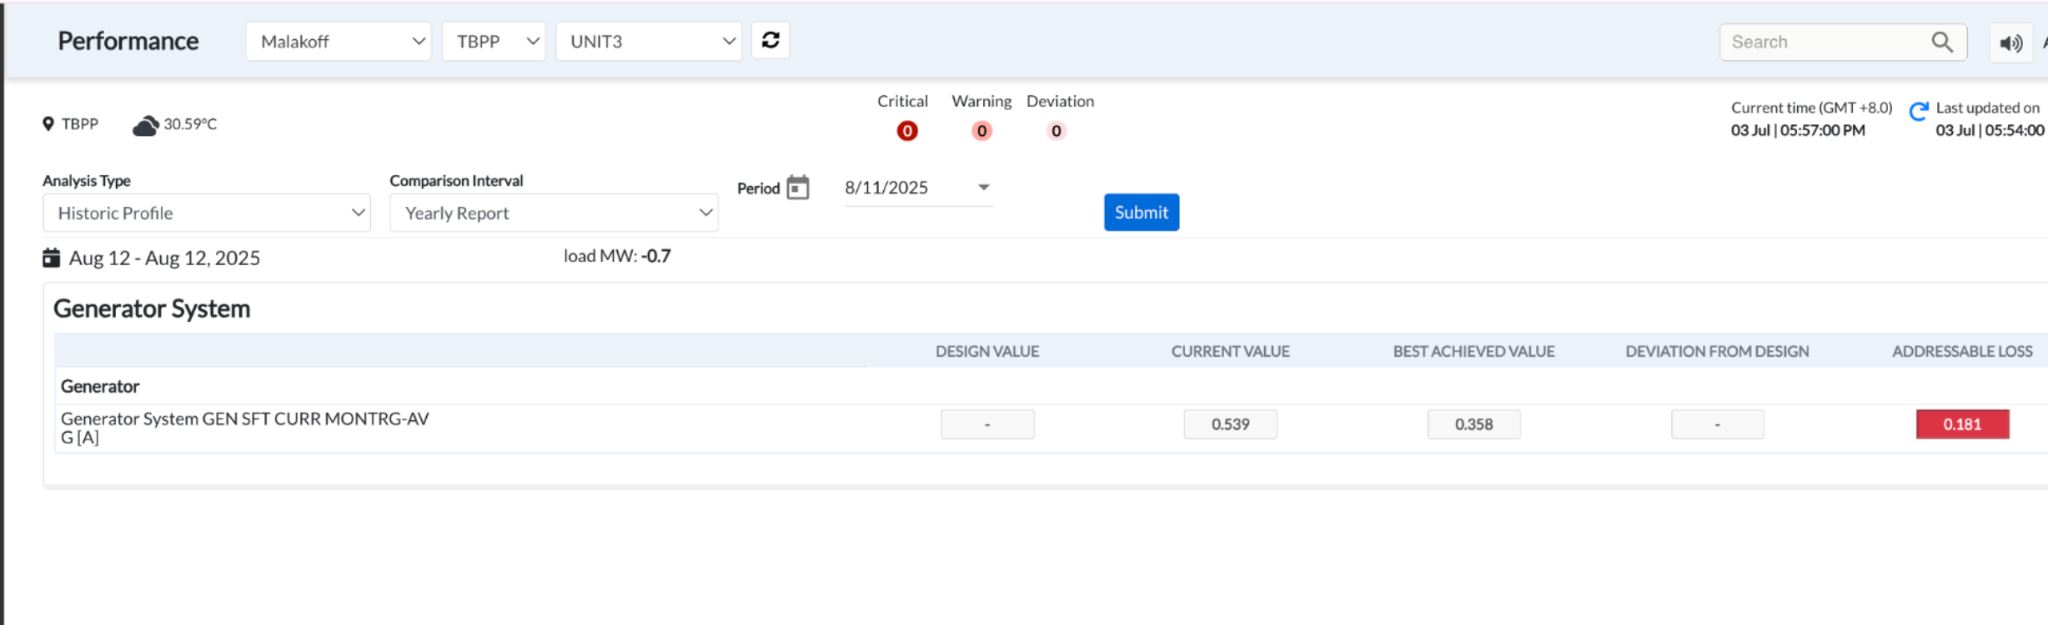
Figure 34. Performance Report
Each row represents a monitored parameter and compares its current operating value with historical and design references.
The report includes the following information:
---------------- ----------------------------------------------------- Field Description
Design Value The expected value used as the engineering reference during system design.
Current The actual operating value recorded for the selected Value reporting period.
Best Achieved The best historical value recorded by the system for Value the selected parameter.
Deviation from The difference between the current operating value Design and the design value.
Addressable The estimated performance loss that may be improved Loss through operational or maintenance actions. ---------------- -----------------------------------------------------
These values help engineers determine whether the system is operating close to its expected performance or if further investigation is required.
¶ 9.6 Using the Performance Report
The Performance module can be used to:
-
Compare current operating performance with historical plant performance.
-
Identify equipment or systems operating below their design expectations.
-
Review performance trends over different reporting periods.
-
Estimate addressable losses that may be reduced through operational improvements.
-
Support performance review and optimization activities.
The Performance module provides a structured view of plant efficiency, enabling engineers to make informed decisions based on historical operating data rather than instantaneous process values.
¶ 10. Analyze
The Analyze module is used to perform detailed analysis of process and equipment data. It allows users to visualize historical trends, compare process parameters, study relationships between different operating variables, and evaluate plant performance over a selected time period.
Unlike the Dashboard and Asset Monitor, which focus on operational monitoring, the Analyze module is intended for engineering investigation and performance analysis. It provides multiple visualization tools that help users identify abnormal behaviour, compare historical operating conditions, and investigate process deviations.
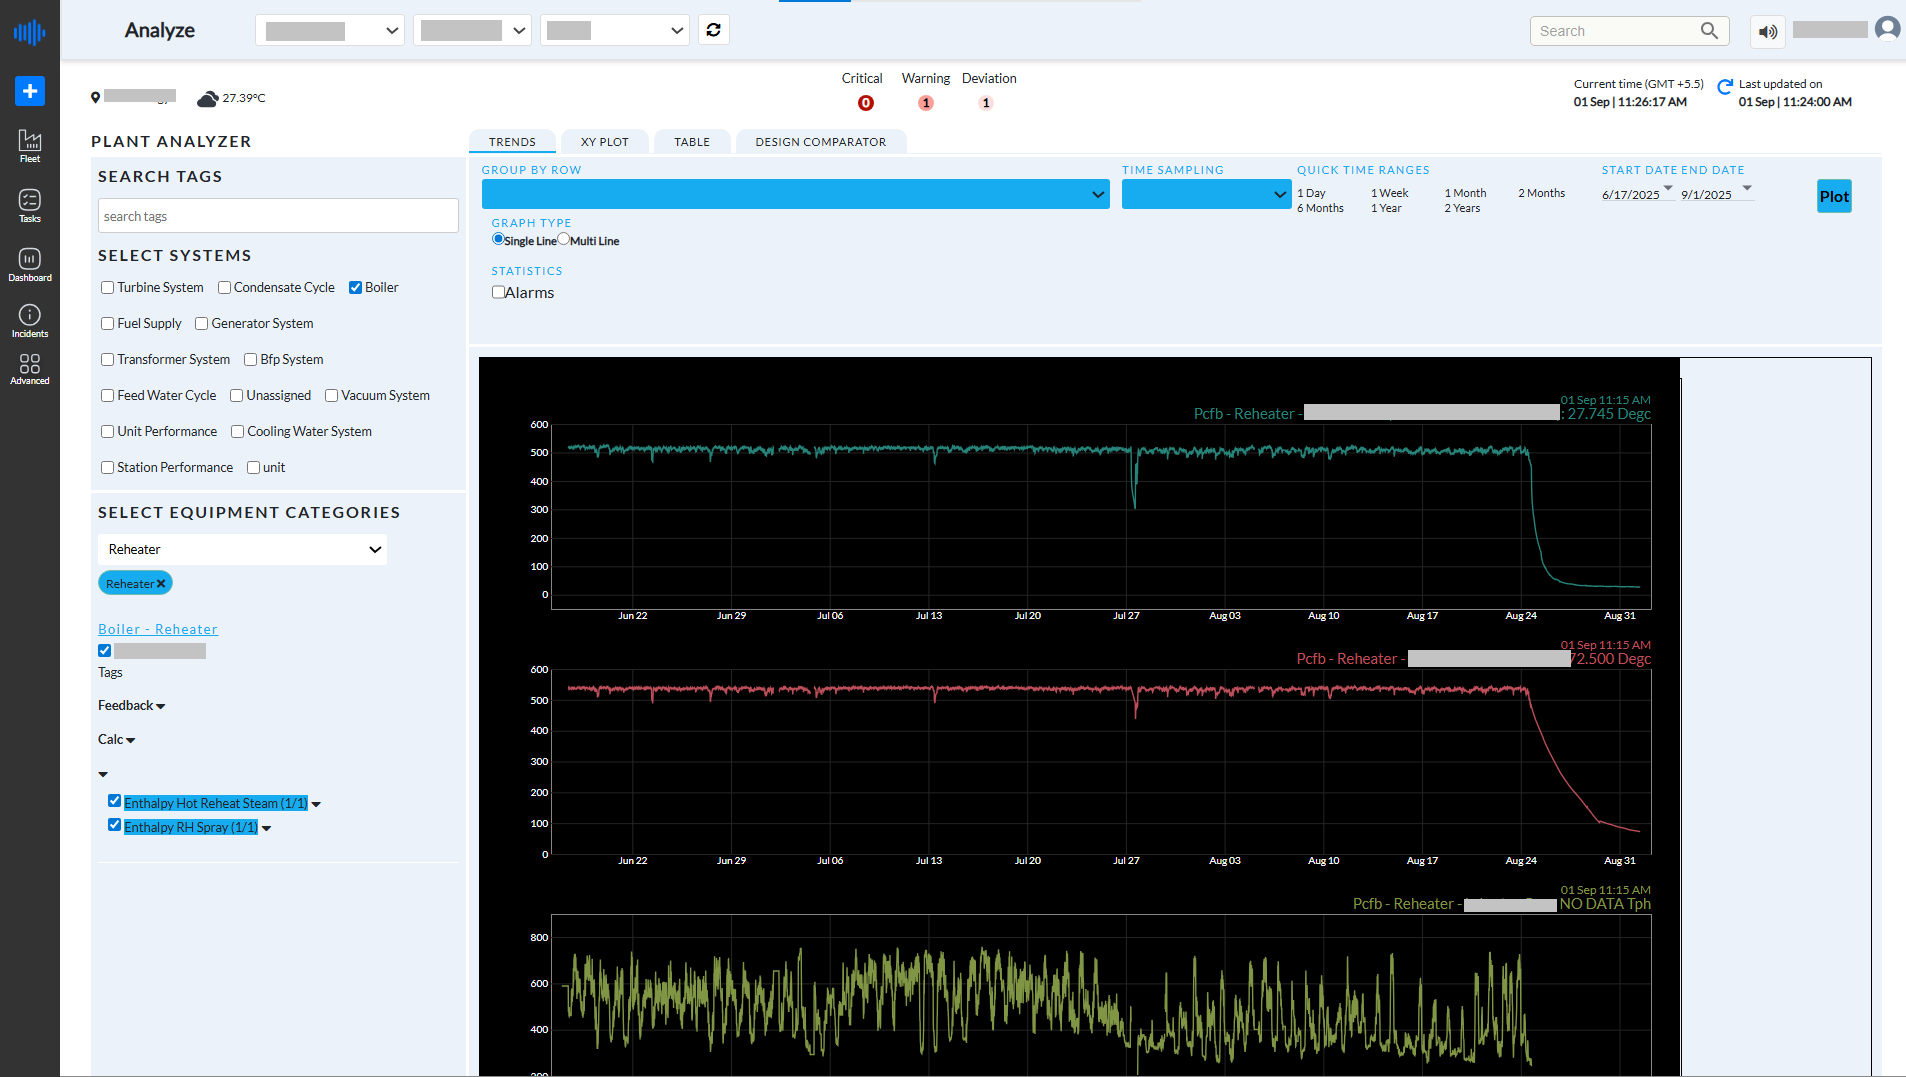
Figure 35. Analyze Module
¶ 10.1 Analyze Workspace
The Analyze page allows users to configure the data that will be displayed for analysis. Users can search for process tags, select the required system and equipment, choose the relevant tag groups, define the analysis period, and generate plots for the selected parameters.
The page includes controls for:
-
Search Tags
-
System Selection
-
Equipment Categories
-
Tag Groups
-
Time Sampling
-
Date Range
-
Plot Generation
Once the required parameters are selected, Pulse retrieves the corresponding historical data and displays it using the selected visualization.
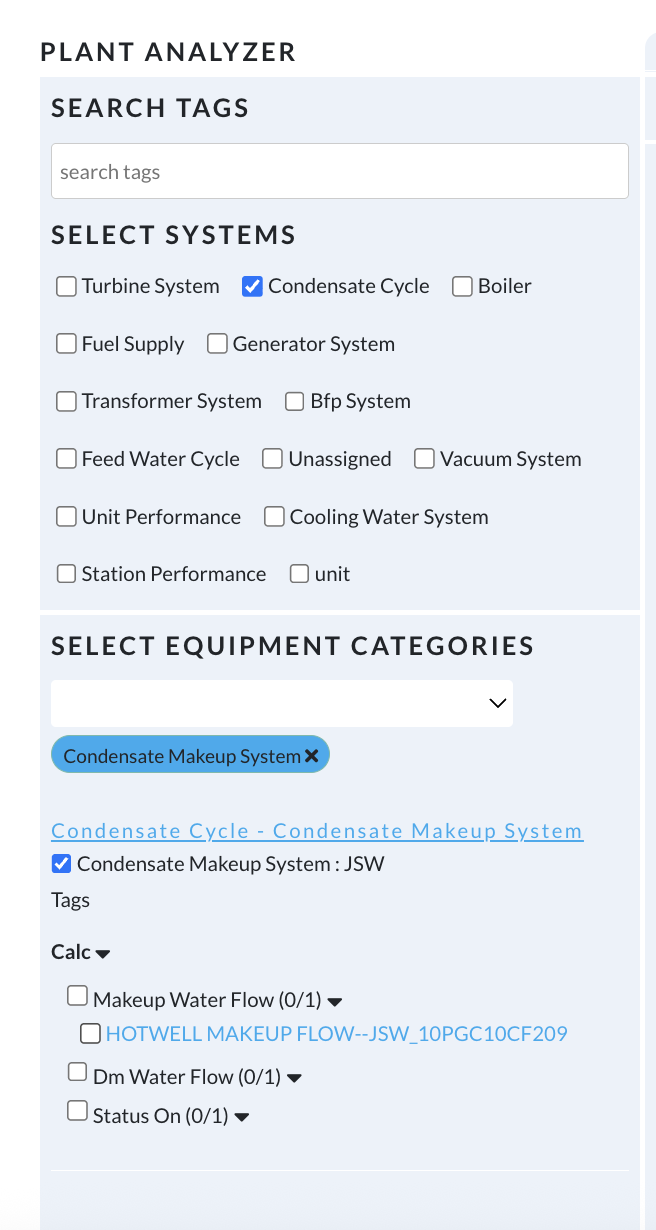
Figure 36. Analyze Workspace
¶ 10.2 Trend Analysis
The Trends view displays historical values of one or more process parameters over time. Users can compare multiple tags on a single graph or display each parameter separately, depending on the selected graph type.
The available options include:
-
Single Line and Multi Line graphs
-
Adjustable time sampling
-
Quick time range selection
-
Custom date range
-
Alarm overlay (if configured)
Trend analysis helps engineers observe changes in operating conditions, compare related parameters, and identify abnormal behaviour that may require further investigation.

Figure 37. Trend Analysis
¶ 10.3 XY Plot
The XY Plot compares two selected process parameters using a scatter plot. Instead of showing values over time, it displays the relationship between the selected variables, making it easier to identify operating patterns, correlations, and unusual behaviour.
This view is commonly used to compare process variables and evaluate how equipment performs under different operating conditions.
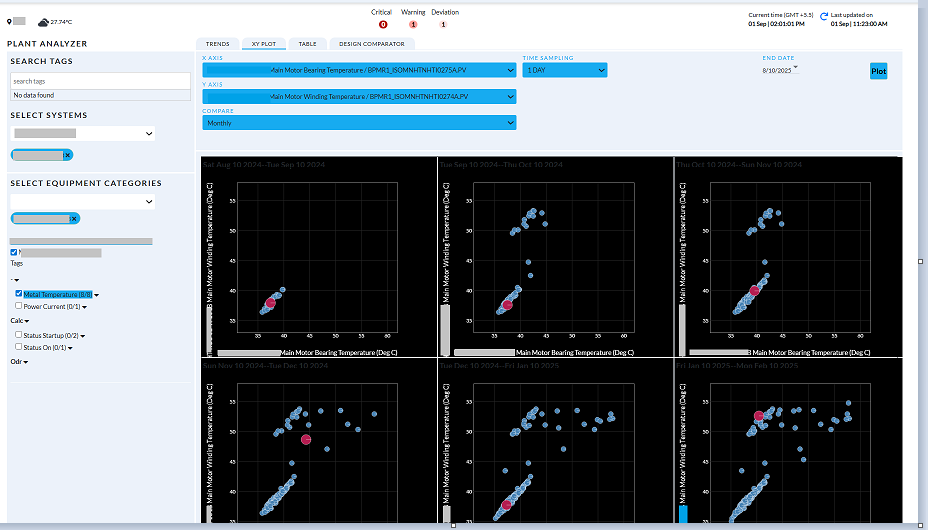
Figure 38. XY Plot
¶ 10.4 Table View and Design Comparison
The Analyze module also provides a Table View, where process values can be reviewed in a tabular format and exported for further analysis.
These views are primarily intended for engineering analysis and performance evaluation.
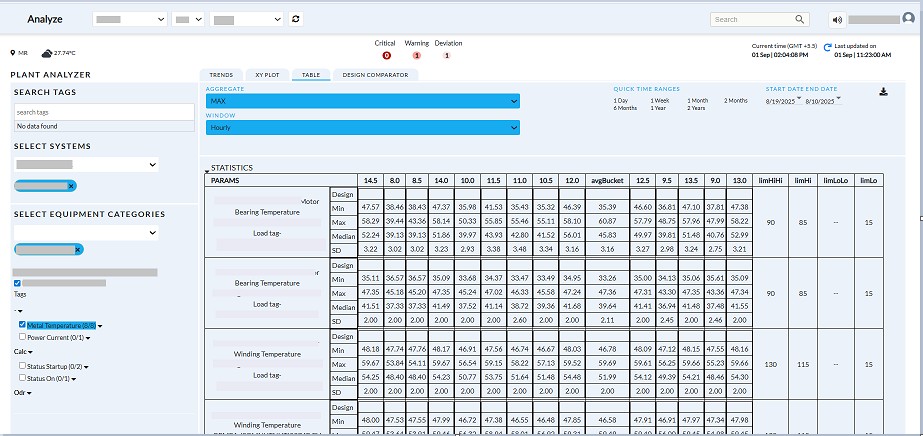
Figure 39. Table View
The Design Comparator allows engineers to compare current operating values with predefined design values or historical reference values. This helps evaluate deviations from expected operating conditions and supports performance assessment.
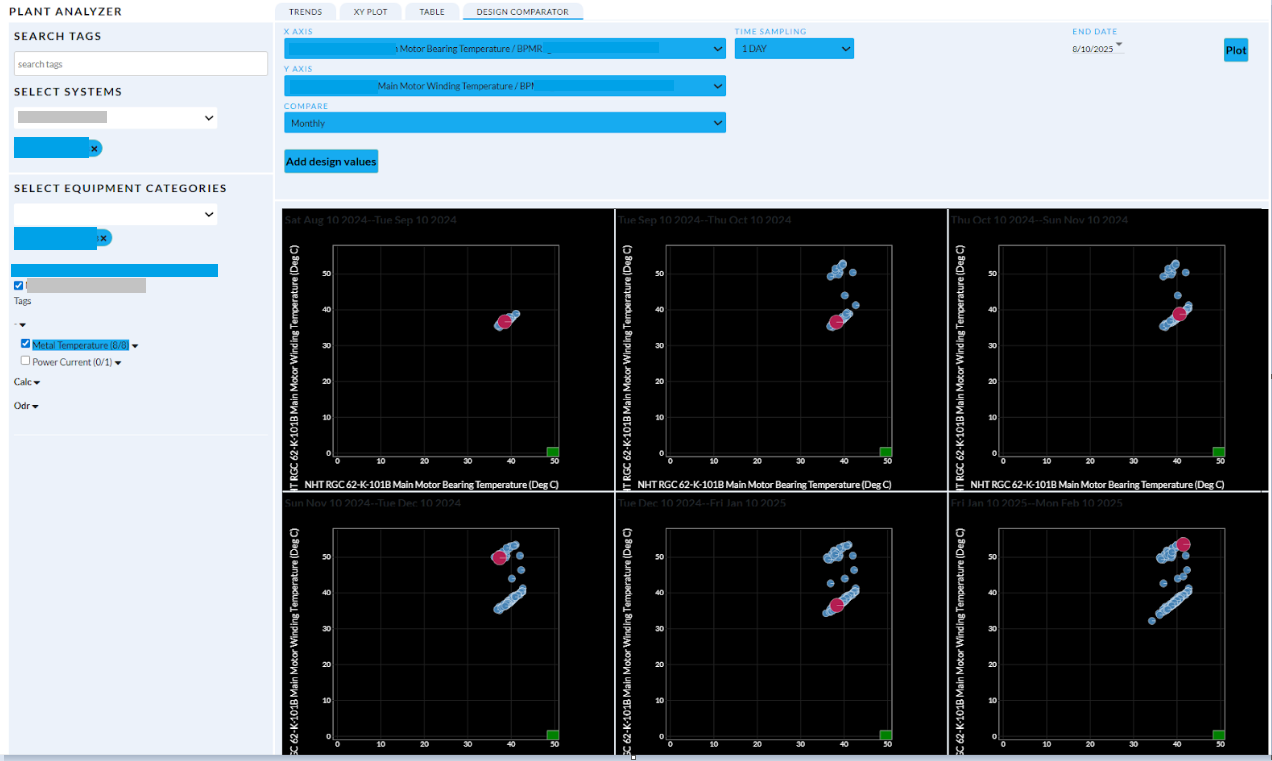
Figure 40. Design Comparator
¶ 11. Failures
The Failures module is used to record and review equipment failures, planned shutdowns, and unplanned outages across the plant. It provides a centralized history of failure events along with key maintenance statistics, helping users understand equipment reliability and downtime.
The information captured in this module can be used for maintenance planning, reliability analysis, and reviewing the operational history of plant assets.
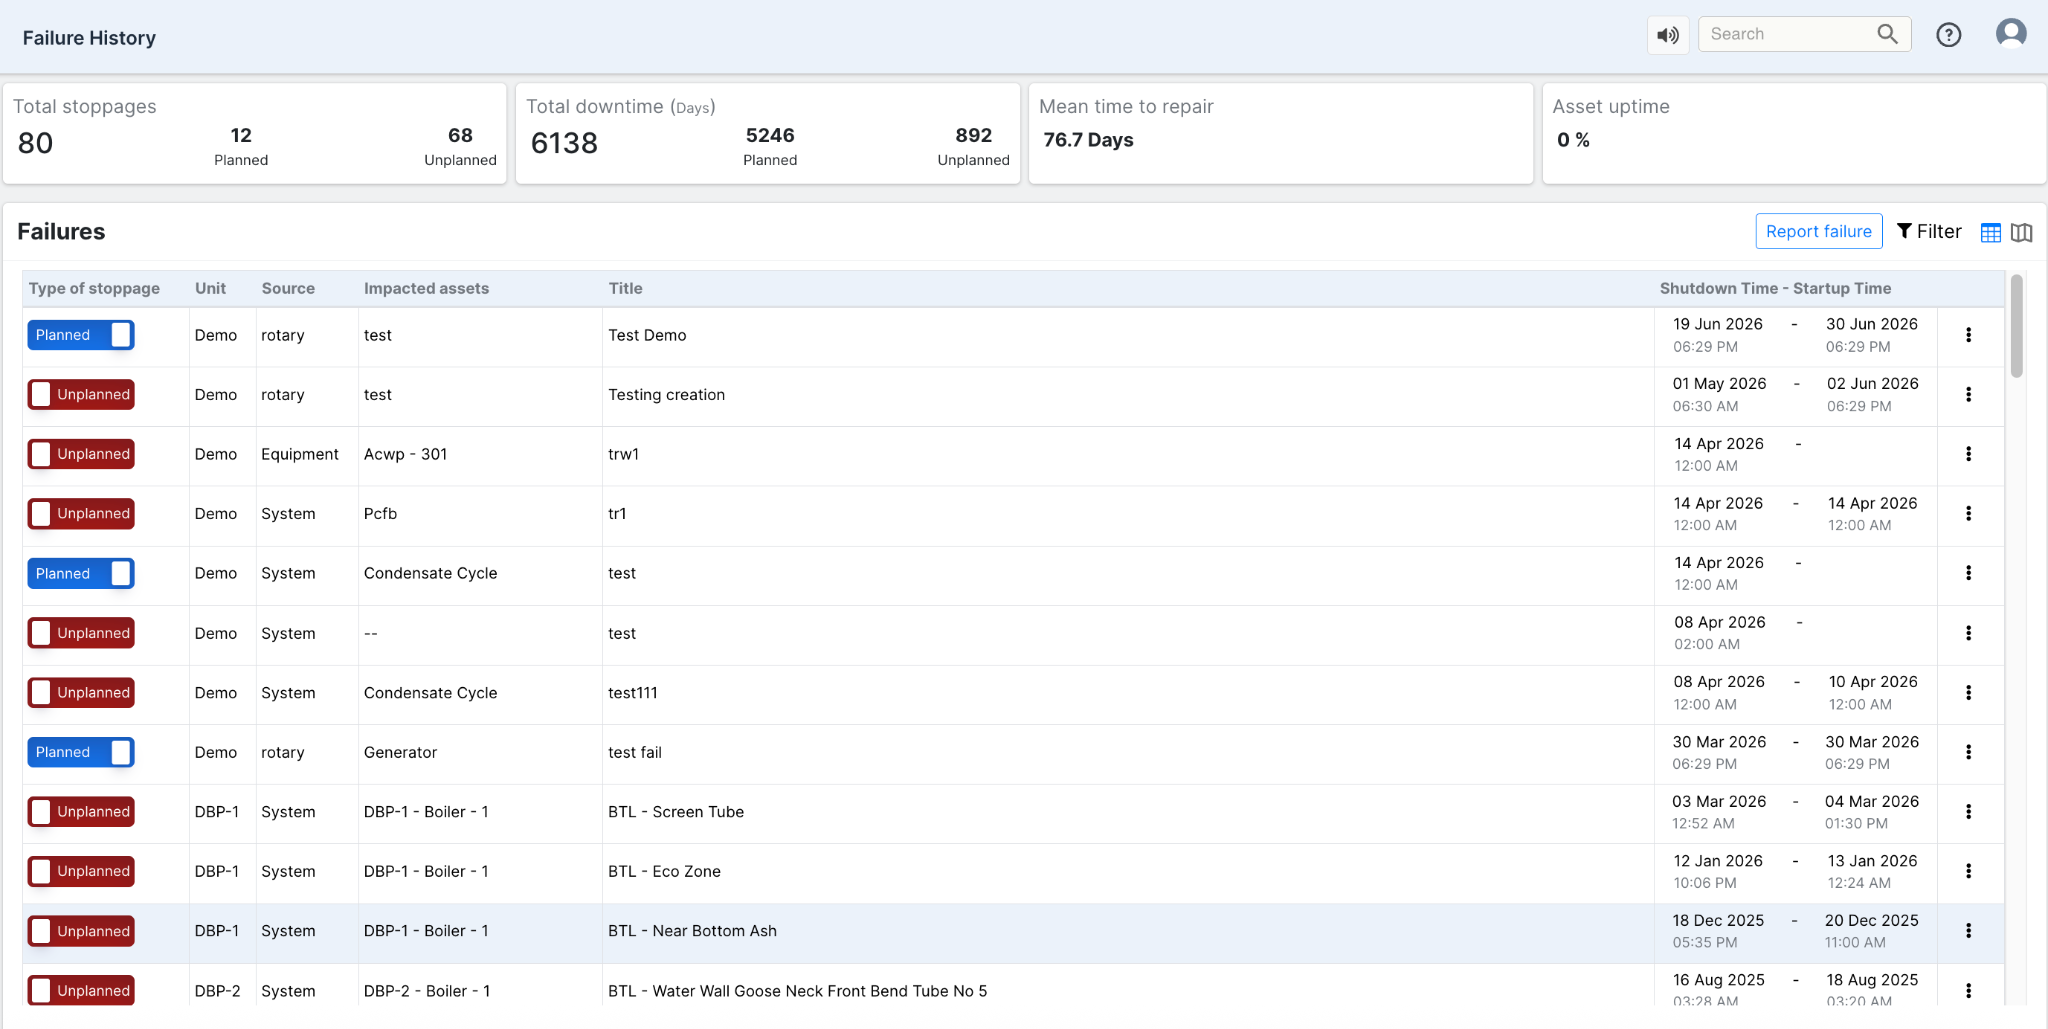
Figure 41. Failures Module
¶ 11.1 Failure Dashboard
The upper section of the page displays a summary of plant failure statistics, providing a quick overview of equipment reliability.
The dashboard includes the following information:
-
Total Stoppages -- Total number of recorded planned and unplanned shutdowns.
-
Total Downtime -- Overall downtime accumulated due to recorded failures.
-
Mean Time to Repair (MTTR) -- Average time taken to restore equipment after a failure.
-
Asset Uptime -- Percentage of time the monitored assets remained operational.
These summary indicators help maintenance and operations teams quickly assess plant performance and identify areas requiring attention.
¶ 11.2 Failure History
The lower section of the page displays the complete history of recorded failures.
Each record contains information such as:
-
Type of stoppage (Planned or Unplanned)
-
Unit
-
Failure source
-
Impacted asset
-
Failure title or description
-
Shutdown and startup time
The failure list provides a chronological view of maintenance events, allowing users to review previous failures and understand the operating history of an asset.
¶ 11.3 Reporting a Failure
Users can record a new failure by clicking the Report Failure button available at the top of the page.
When creating a failure record, users enter the required information related to the affected asset, stoppage type, and shutdown details. Once saved, the failure becomes part of the plant's historical maintenance record and is available for future reference and analysis.
¶ 11.4 Filtering Failure Records
The Filter option allows users to narrow the displayed records based on the required criteria. This helps users quickly locate specific failure events without manually searching through the complete history.
Depending on the project configuration, failures can be filtered using parameters such as unit, stoppage type, asset, or reporting period.
¶ 12. Reports
The Reports module allows users to generate, view, and download reports based on plant operational data, incidents, KPIs, and asset performance. Reports provide a structured summary of plant activities over a selected period and can be used for operational reviews, maintenance planning, and management reporting.
The report content available to users depends on the project configuration and the reports enabled for the deployment.
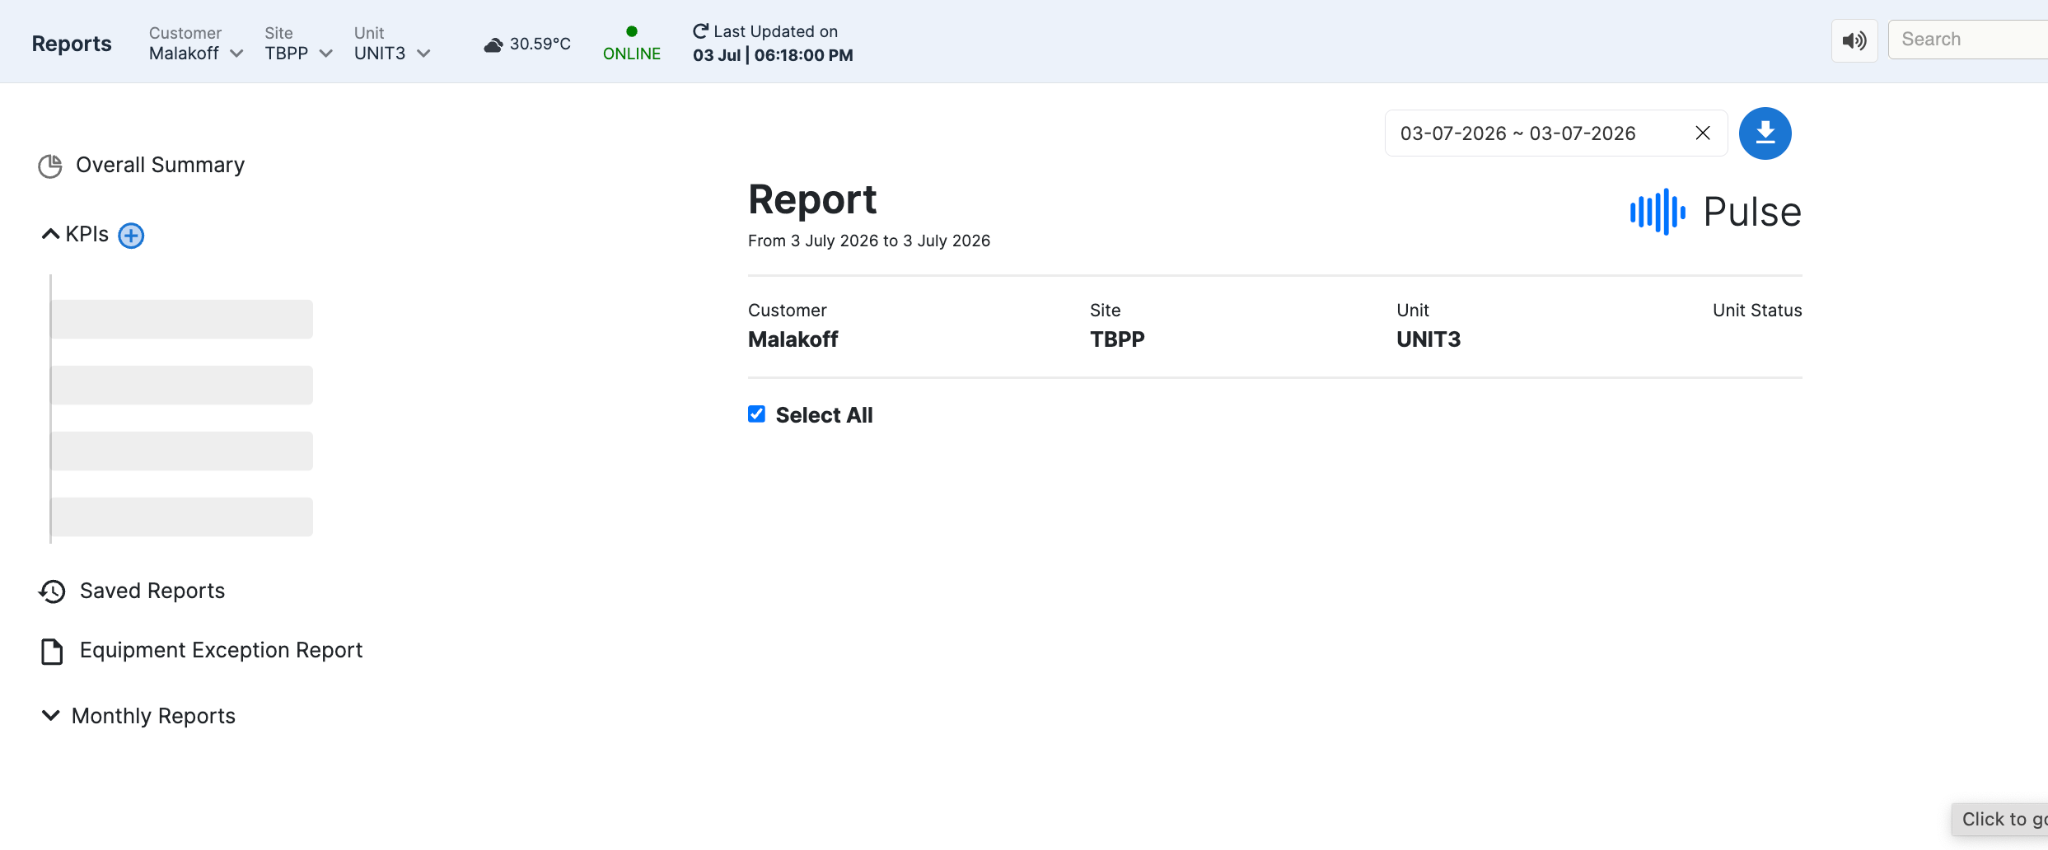
Figure 42. Reports Module
¶ 12.1 Reports Overview
The Reports page displays the available report categories in the left navigation panel. Users can select a report, specify the required reporting period, and generate the corresponding report.
Depending on the project configuration, the Reports module may include:
-
Overall Summary
-
KPI Reports
-
Saved Reports
-
Equipment Exception Report
-
Monthly Reports
The report period can be changed using the date range selector at the top of the page. Once the report is generated, it can be downloaded using the Download button.
¶ 12.2 Monthly Reports
Pulse provides predefined monthly reports that summarize plant performance and operational activities for the selected reporting period.
One of the available reports is the Task Recommendation Matrix, which presents incident-related recommendations and their implementation status.
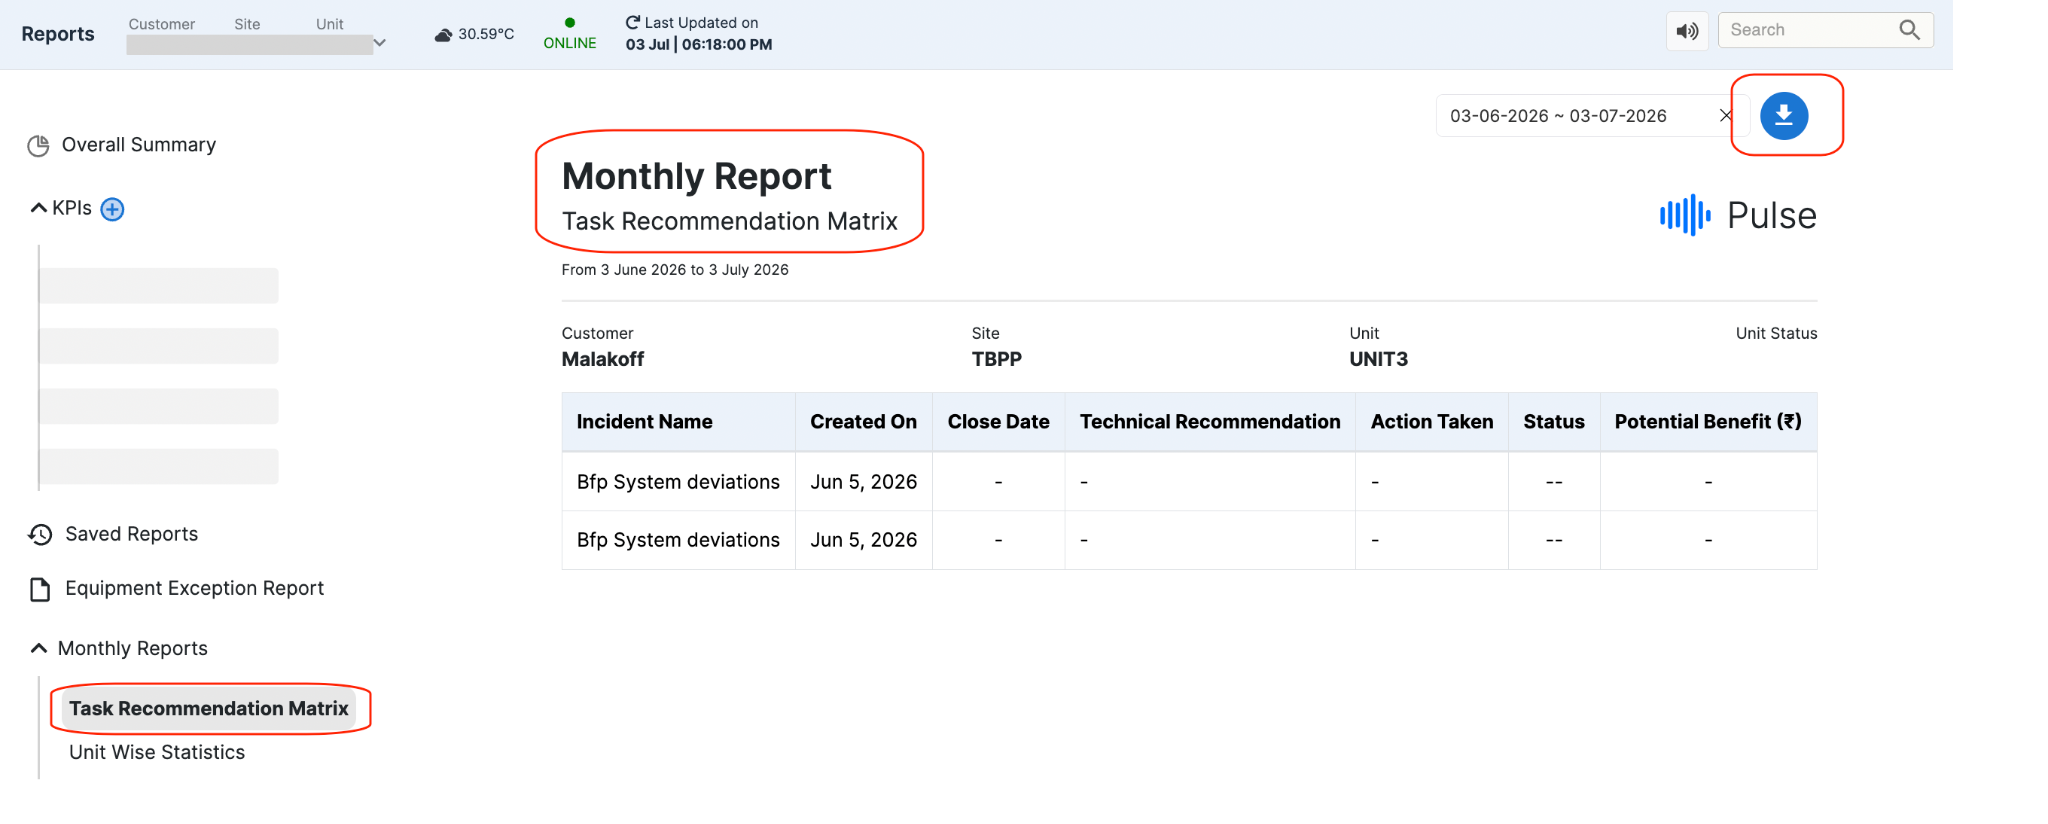
Figure 43. Monthly Report -- Task Recommendation Matrix
The report includes information such as:
-
Incident Name
-
Created Date
-
Close Date
-
Technical Recommendation
-
Action Taken
-
Current Status
-
Potential Benefit
This report helps users review the recommendations generated during the reporting period and monitor their implementation.
Another predefined report is Unit Wise Statistics, which provides an overall summary of equipment availability and reliability for each monitored system.
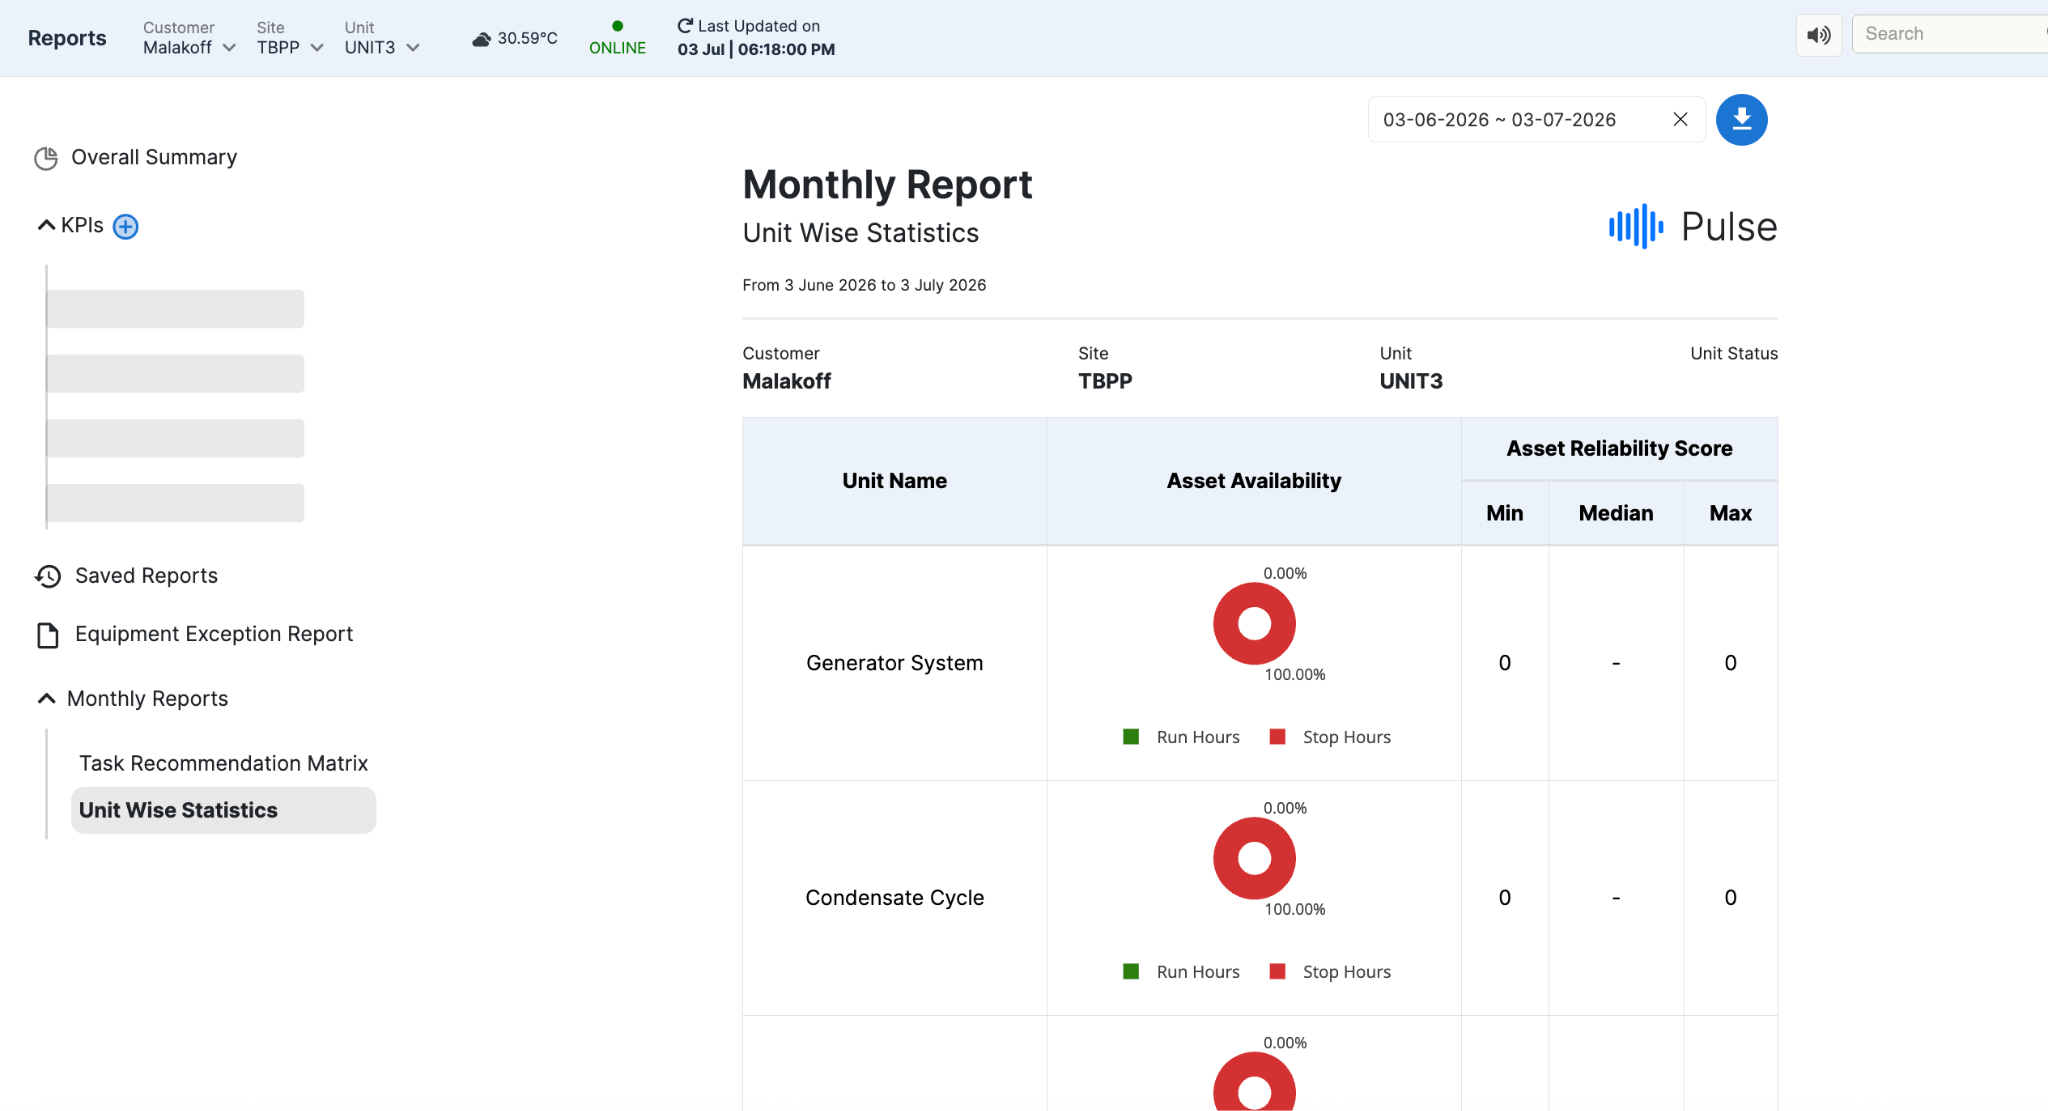
Figure 44. Monthly Report -- Unit Wise Statistics
The report includes key information such as:
-
Unit Name
-
Asset Availability
-
Run Hours and Stop Hours
-
Asset Reliability Score (Minimum, Median, and Maximum)
These reports provide a consolidated view of plant performance and support periodic operational and management reviews.
¶ 12.3 KPI Reports
The Reports module also allows users to create custom KPI reports by selecting the required process parameters and configuration details.
To create a KPI report, click the Add KPI icon and provide the required information such as the KPI type, data tag, system, limits, and other applicable fields.
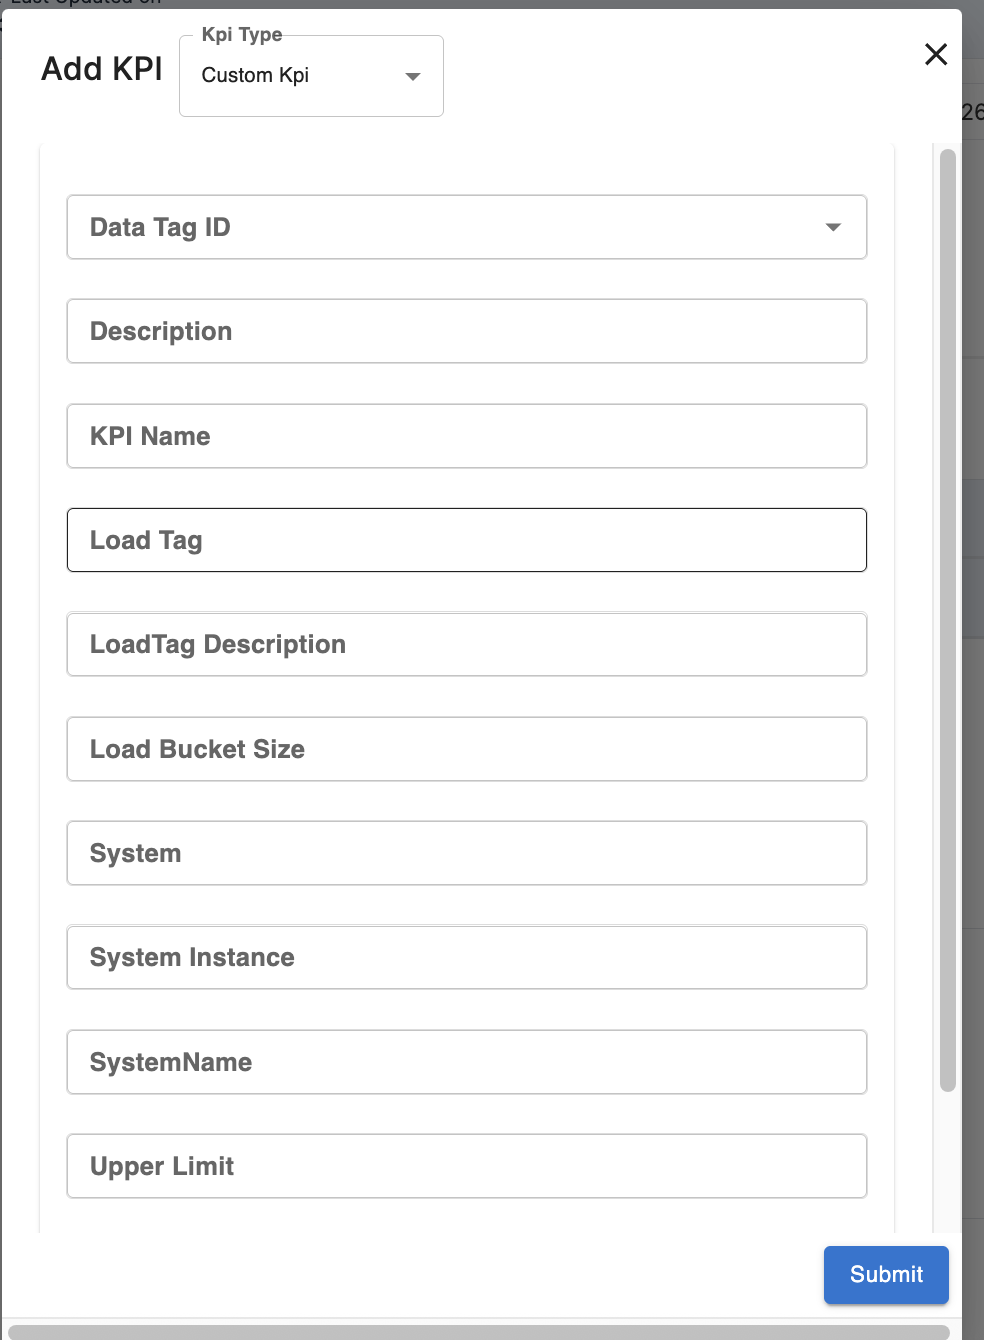
Figure 45. Add KPI
Once configured, the KPI can be included in future reports and used to monitor specific operational or performance indicators.
¶ 13. Management Dashboard
The Management Dashboard provides a consolidated view of the operational and financial benefits achieved through Pulse. It helps plant managers, reliability engineers, and management teams monitor savings, compare performance across systems, and generate reports over a selected time period.
Unlike the operational dashboards that focus on day-to-day monitoring, the Management Dashboard highlights business outcomes such as process improvements, reliability gains, and estimated financial benefits.
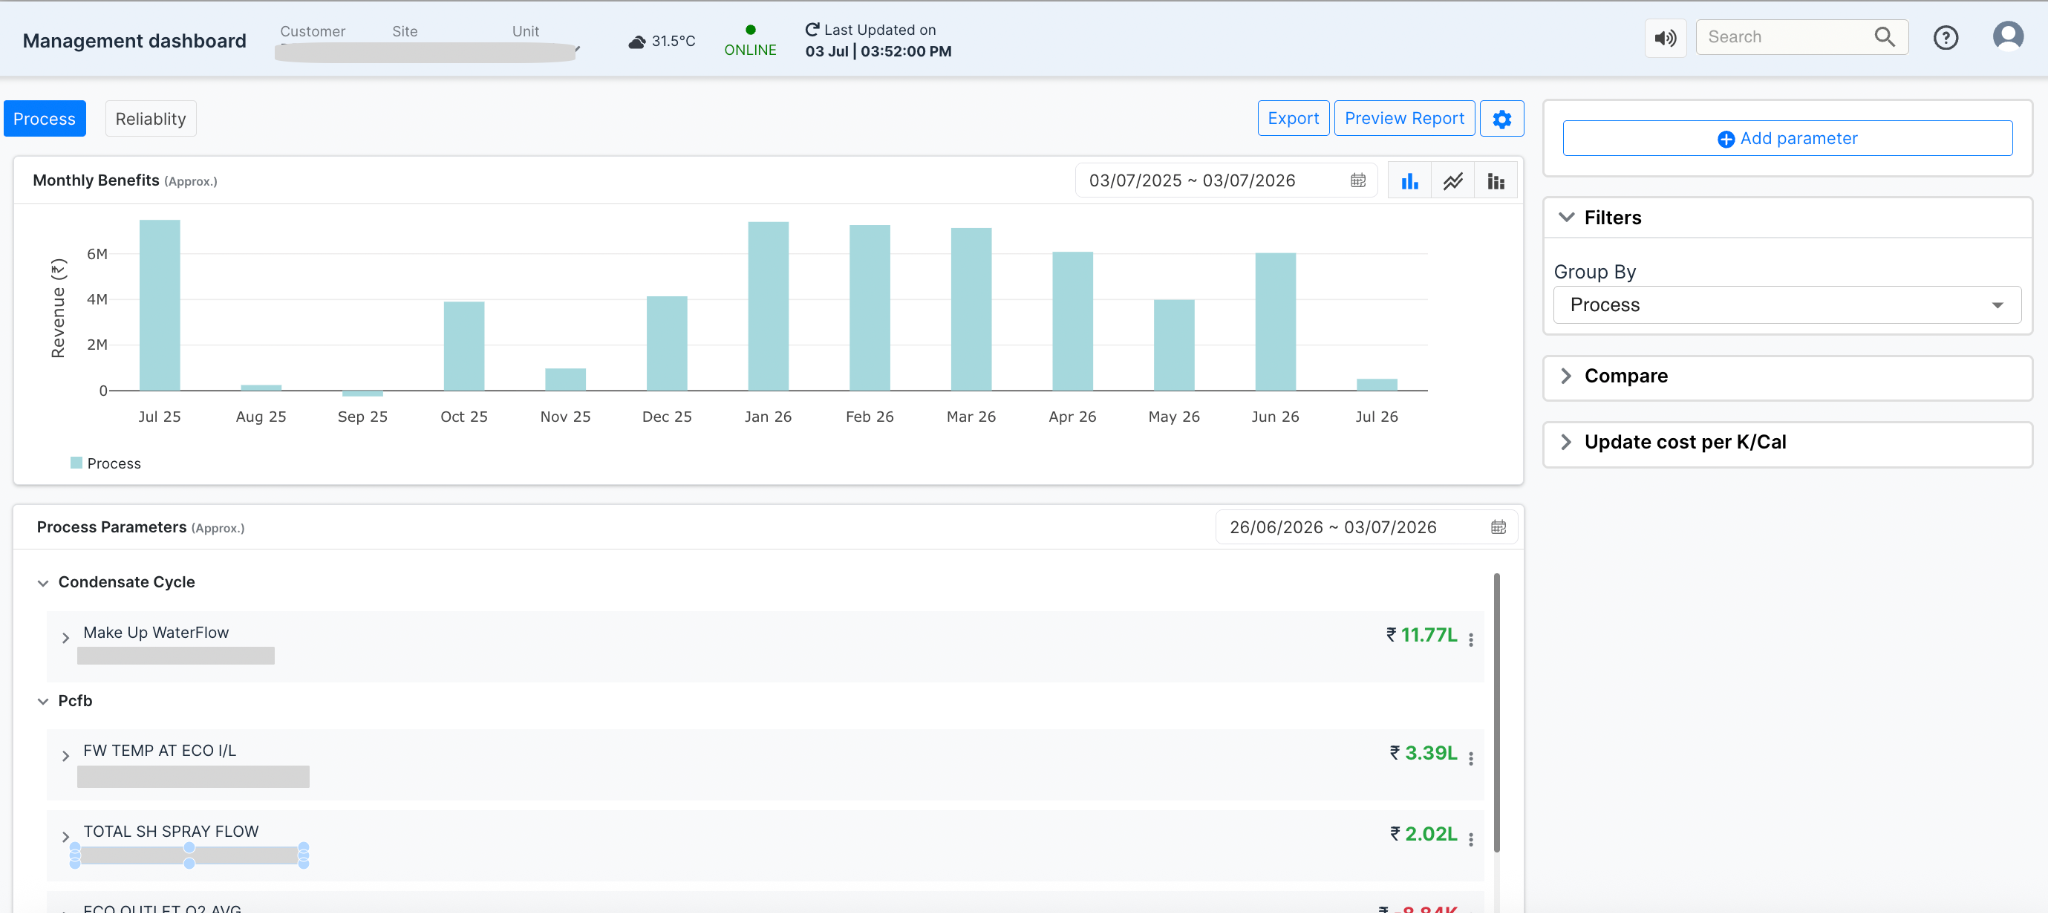
Figure 42. Management Dashboard
¶ 13.1 Viewing Process and Reliability Benefits
The Management Dashboard contains two primary views:
-
Process -- Displays benefits achieved through process optimization and operational improvements.
-
Reliability -- Displays benefits related to asset reliability, maintenance improvements, and equipment health.
Users can switch between these views using the tabs available at the top of the page.
The Monthly Benefits chart displays the estimated financial benefit for the selected time period, allowing users to understand how savings have changed over time.

Figure 43. Switch tabs
¶ 13.2 Process Dashboard
The Process tab focuses on operational improvements achieved through process optimization. It helps users understand how changes in operating parameters have contributed to improved plant performance and financial savings.
The upper section of the page displays the Monthly Benefits graph, showing the estimated revenue or savings generated over the selected period.
Below the graph, the Process Parameters section lists individual systems and process tags that have contributed to these benefits. Each process can be expanded to view the associated parameters and their estimated financial impact.
Positive values indicate areas where process optimization has resulted in measurable benefits, while negative values highlight opportunities where further optimization may be required.
This view enables engineers and plant managers to identify which operating parameters have had the greatest impact on overall plant performance.
¶ 13.3 Reviewing Monthly Benefits
The upper section of the page displays a graphical representation of the estimated monthly benefits.
Users can:
-
Select a custom date range.
-
View monthly benefit trends.
-
Compare benefits over different periods.
-
Export or preview reports.
This graph provides a quick summary of the value generated through recommendations and actions implemented in Pulse. This can be seen in the bar chart, line chart or stack chart as users choice. User can select which type of chart is needed for visuals.
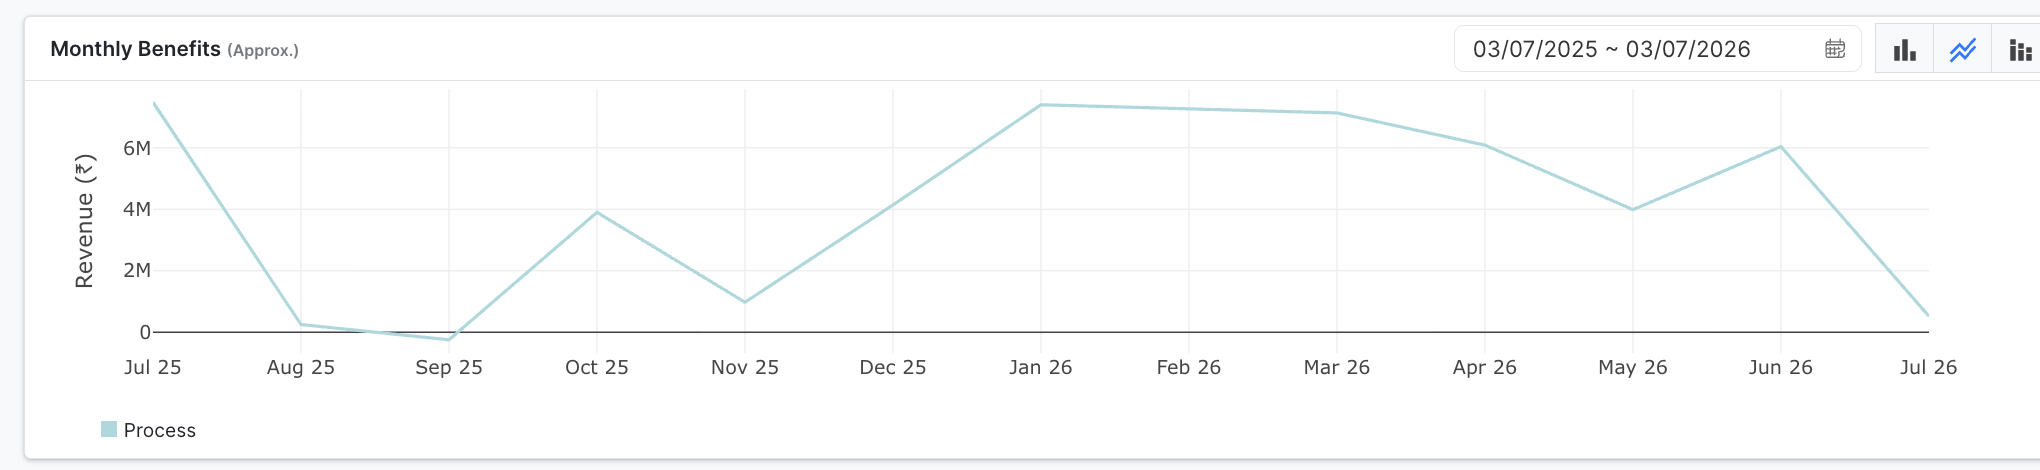
Figure 44. Monthly Benefits
¶ 13.4 Reviewing Process Parameters
The lower section displays the process parameters that contributed to the calculated benefits.
Each process area can be expanded to view individual parameters along with their estimated financial impact.
Positive values indicate process improvements, while negative values indicate opportunities that may require further investigation.
This information helps engineers understand which operating parameters have contributed most to plant performance.
¶ 13.5 Applying Filters and Comparisons
The panel on the right side of the page allows users to customize the displayed information.
Available options include:
-
Group data by process or other available categories.
-
Apply filters to narrow the displayed results.
-
Compare different periods or operating conditions.
-
Update cost per KCal values used for benefit calculations.
These options allow users to generate reports that are relevant to a specific analysis or reporting period.
¶ 13.6 Exporting Management Reports
The Export and Preview Report options can be used to generate management reports based on the selected filters and date range.
These reports can be shared with plant management and stakeholders to review operational improvements, process benefits, and overall plant performance.
¶ 13.2 Reliability Dashboard
The Reliability tab provides an overview of the benefits achieved through improved asset reliability and maintenance activities.
Instead of focusing on process optimization, this view highlights improvements related to equipment health, reduced failures, increased asset availability, and overall plant reliability.
Depending on the project configuration, the dashboard may display information such as:
-
Asset reliability trends
-
Equipment availability
-
Failure reduction statistics
-
Maintenance effectiveness
-
Reliability improvement benefits
-
Estimated cost savings achieved through improved reliability
This information helps maintenance and reliability teams measure the effectiveness of predictive maintenance strategies and understand how improved equipment performance contributes to overall plant reliability and business value.
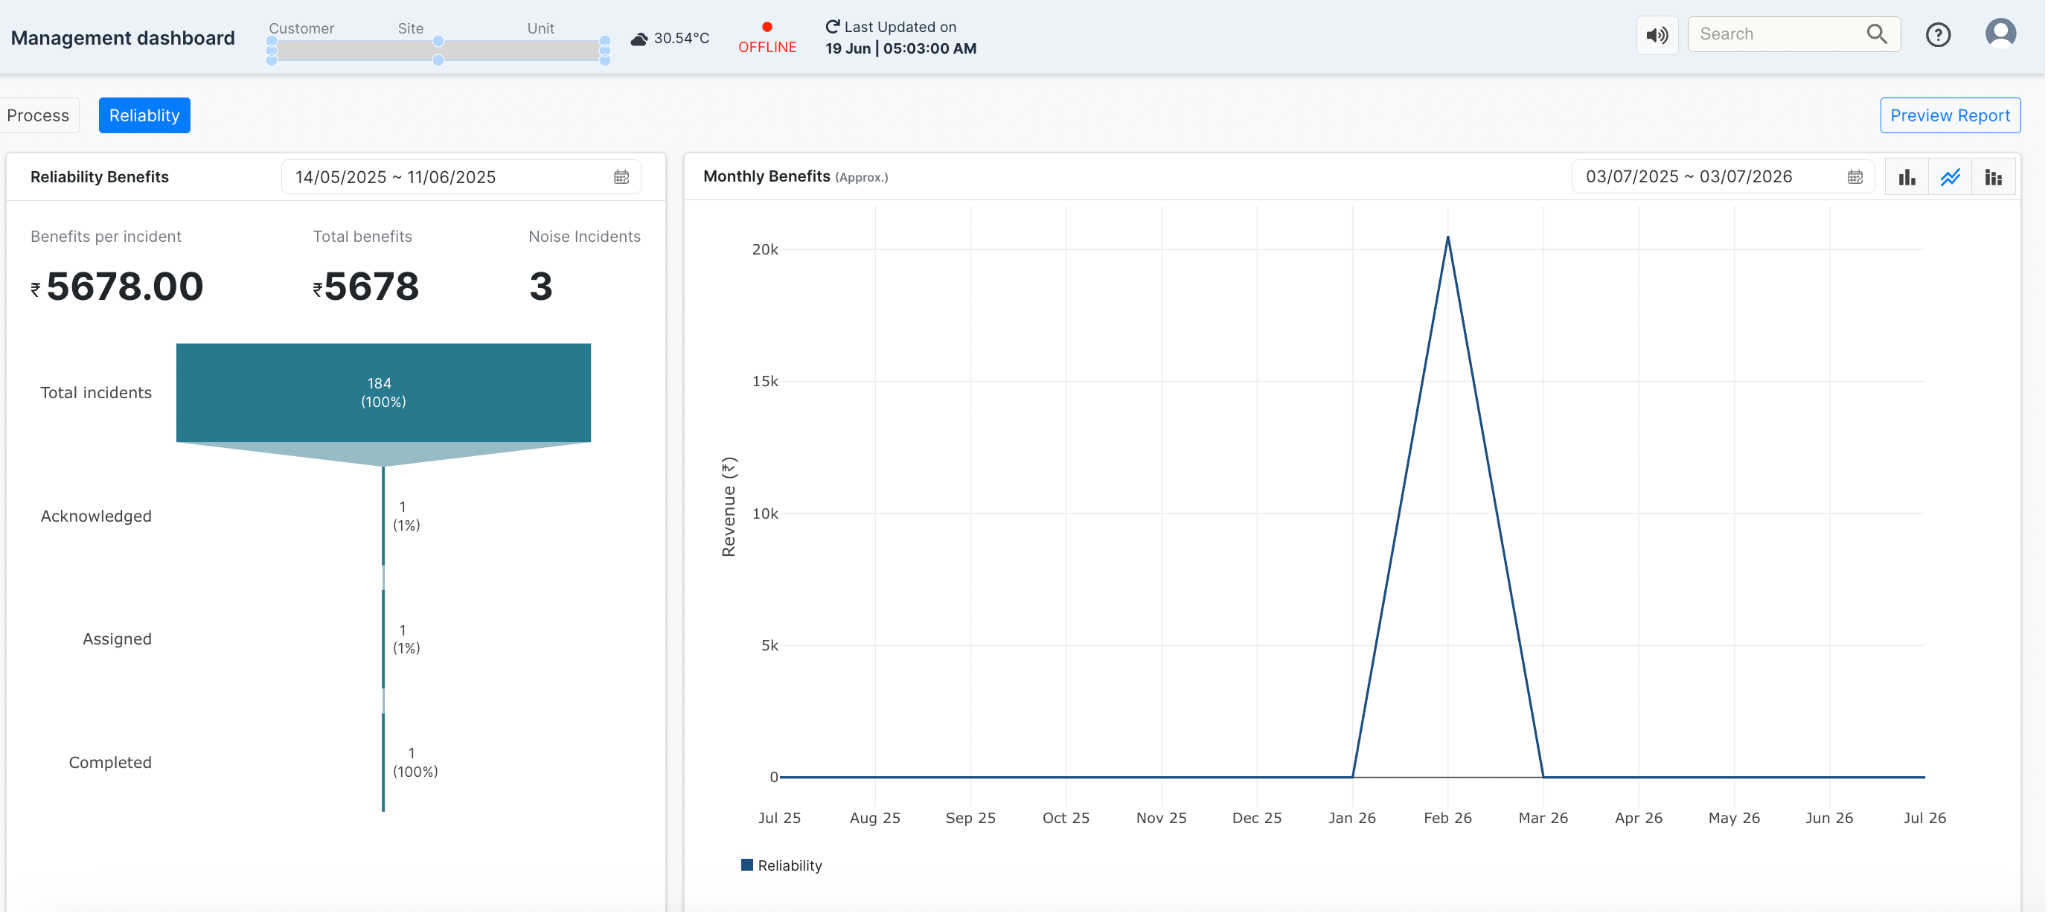
Figure 43. Management Dashboard -- Reliability View